
You call /api/v1/predictions/BTCUSDT. Under 50 milliseconds later, you get back an action, a confidence score, and three price levels. Between request and response, your query passes through a data pipeline that ingests live market feeds, computes proprietary features, runs an ensemble of models, calibrates their agreement into a confidence score, and serializes the result.
This post walks through each stage of that pipeline.
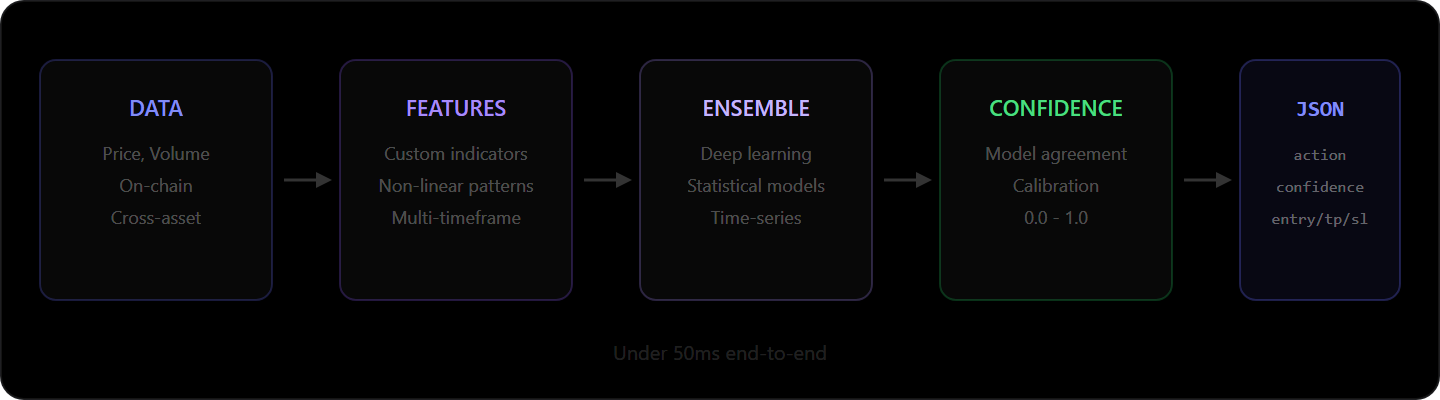
Everything starts with clean data.
Market data arrives from multiple exchanges simultaneously: price, volume, order book depth, and trade flow across spot and derivatives markets. Exchanges format timestamps differently, gaps appear when connections drop, and flash wicks must be filtered without removing legitimate volatility.
On-chain metrics for supported assets include transaction volumes, active addresses, exchange inflows/outflows, and large holder movements. On-chain data shows what is actually moving on the blockchain, not just what is being traded on exchanges.
Cross-asset correlations matter because crypto does not exist in isolation. Bitcoin's correlation with traditional risk assets shifts over time, and altcoin correlations with Bitcoin vary by market regime. A prediction about ETH that ignores what BTC is doing is incomplete.
Standard indicators are table stakes.
The standard approach uses off-the-shelf technical indicators: RSI, MACD, Bollinger Bands, moving average crossovers. When everyone uses the same signals, those signals lose predictive power — the market has already priced them in.
Our indicators are built on more complex mathematical foundations, designed to capture relationships between timeframes, non-linear patterns in order flow, and structural features of price action invisible on a standard chart. Each signal must be computationally expensive enough that it is not trivially reproducible, must capture non-obvious dynamics, and must demonstrate predictive power across different market conditions — not just in backtests cherry-picked from bull runs.
One model has blind spots. That's the point.
We use an ensemble approach — multiple models contributing different perspectives to the same prediction.
Deep learning networks excel at pattern recognition but overfit to recent data. Gradient boosting models resist noise better but miss complex non-linear relationships. Time-series models capture temporal dependencies well but struggle with regime changes.
The ensemble combines these. When models agree strongly, confidence is high. When they disagree, confidence drops — which is the correct behavior.
Confidence means nothing if it isn't calibrated.
Every prediction includes a confidence score between 0 and 1, reflecting model agreement and historical calibration.
Strong ensemble agreement on direction and magnitude produces high confidence (0.80+). Disagreement — some models say BUY while others say HOLD — lowers it. Market conditions the models have not seen before lower it further.
A confidence score is only useful if it is calibrated: 80% confidence should mean the model is right roughly 80% of the time. We continuously calibrate scores against outcomes to keep them meaningful, not optimistic.
A prediction with 0.85 confidence and a 1:2 risk/reward ratio is different from one with 0.62 confidence and the same ratio. Confidence should inform position sizing, stop-loss placement, and whether you take the trade at all.
Markets move. Models that don't are useless.
Markets evolve. A model trained on 2023 data may not work in 2026.
Our models monitor their own performance against real outcomes. When accuracy degrades beyond set thresholds — because the regime has shifted or new patterns have emerged — automated retraining triggers.
This is not real-time learning. We do not chase every new data point, which would cause overfitting. We retrain when there is statistical evidence that the current models no longer capture market dynamics effectively.
What Every API Response Contains
{
  "symbol": "BTCUSDT",
  "action": "BUY",
  "confidence": 0.84,
  "horizon": "long",
  "entry_price": 96250.00,
  "take_profit": 98542.50,
  "stop_loss": 94120.00,
  "analyzed_at": "2026-03-22T10:30:00Z"
}
Every prediction ships with a stop loss. A prediction without risk management is incomplete.
Where We Fall Short
Black swan events. The models learn from historical patterns, so events with no precedent — exchange collapses, regulatory bans, major protocol exploits — are inherently unpredictable. During the Luna/UST collapse, no pattern-based model predicted the magnitude. Ours included.
Regime transitions. When the market shifts from bull to bear, accuracy drops until the new pattern is recognized. Adaptation speed has improved, but it is not instant.
Low-liquidity assets. Predictions are strongest on high-cap, high-volume assets (BTC, ETH, SOL). Thinner order books are more susceptible to manipulation and random noise.
Short-term noise. Short-term predictions are inherently less accurate than long-term ones. More random noise, more microstructure influence, less time for fundamentals to assert themselves.
Price precision. We predict direction and provide a risk/reward framework. The exact price at which a move reverses is not something any model can predict precisely.
The longer you build prediction systems, the more you understand that the real product is not the prediction itself. It is the quality of the uncertainty estimate wrapped around it. Anyone can output a number. The hard part is knowing — and honestly communicating — how much that number is worth. The gap between confidence and certainty is where most prediction systems fail silently. We would rather make that gap visible than pretend it does not exist.
All accuracy claims are based on historical backtesting (2021-2024). Past performance does not guarantee future results. Cryptocurrency markets are volatile and unpredictable. This article does not constitute financial or investment advice. Always consult a licensed financial professional before making trading decisions.