Each market measured on its own and against the portfolio.
Volatility, tail, drawdown, liquidity, funding and crowding for every perpetual market covered, compared across the market, and what each asset would add to the portfolio's risk.
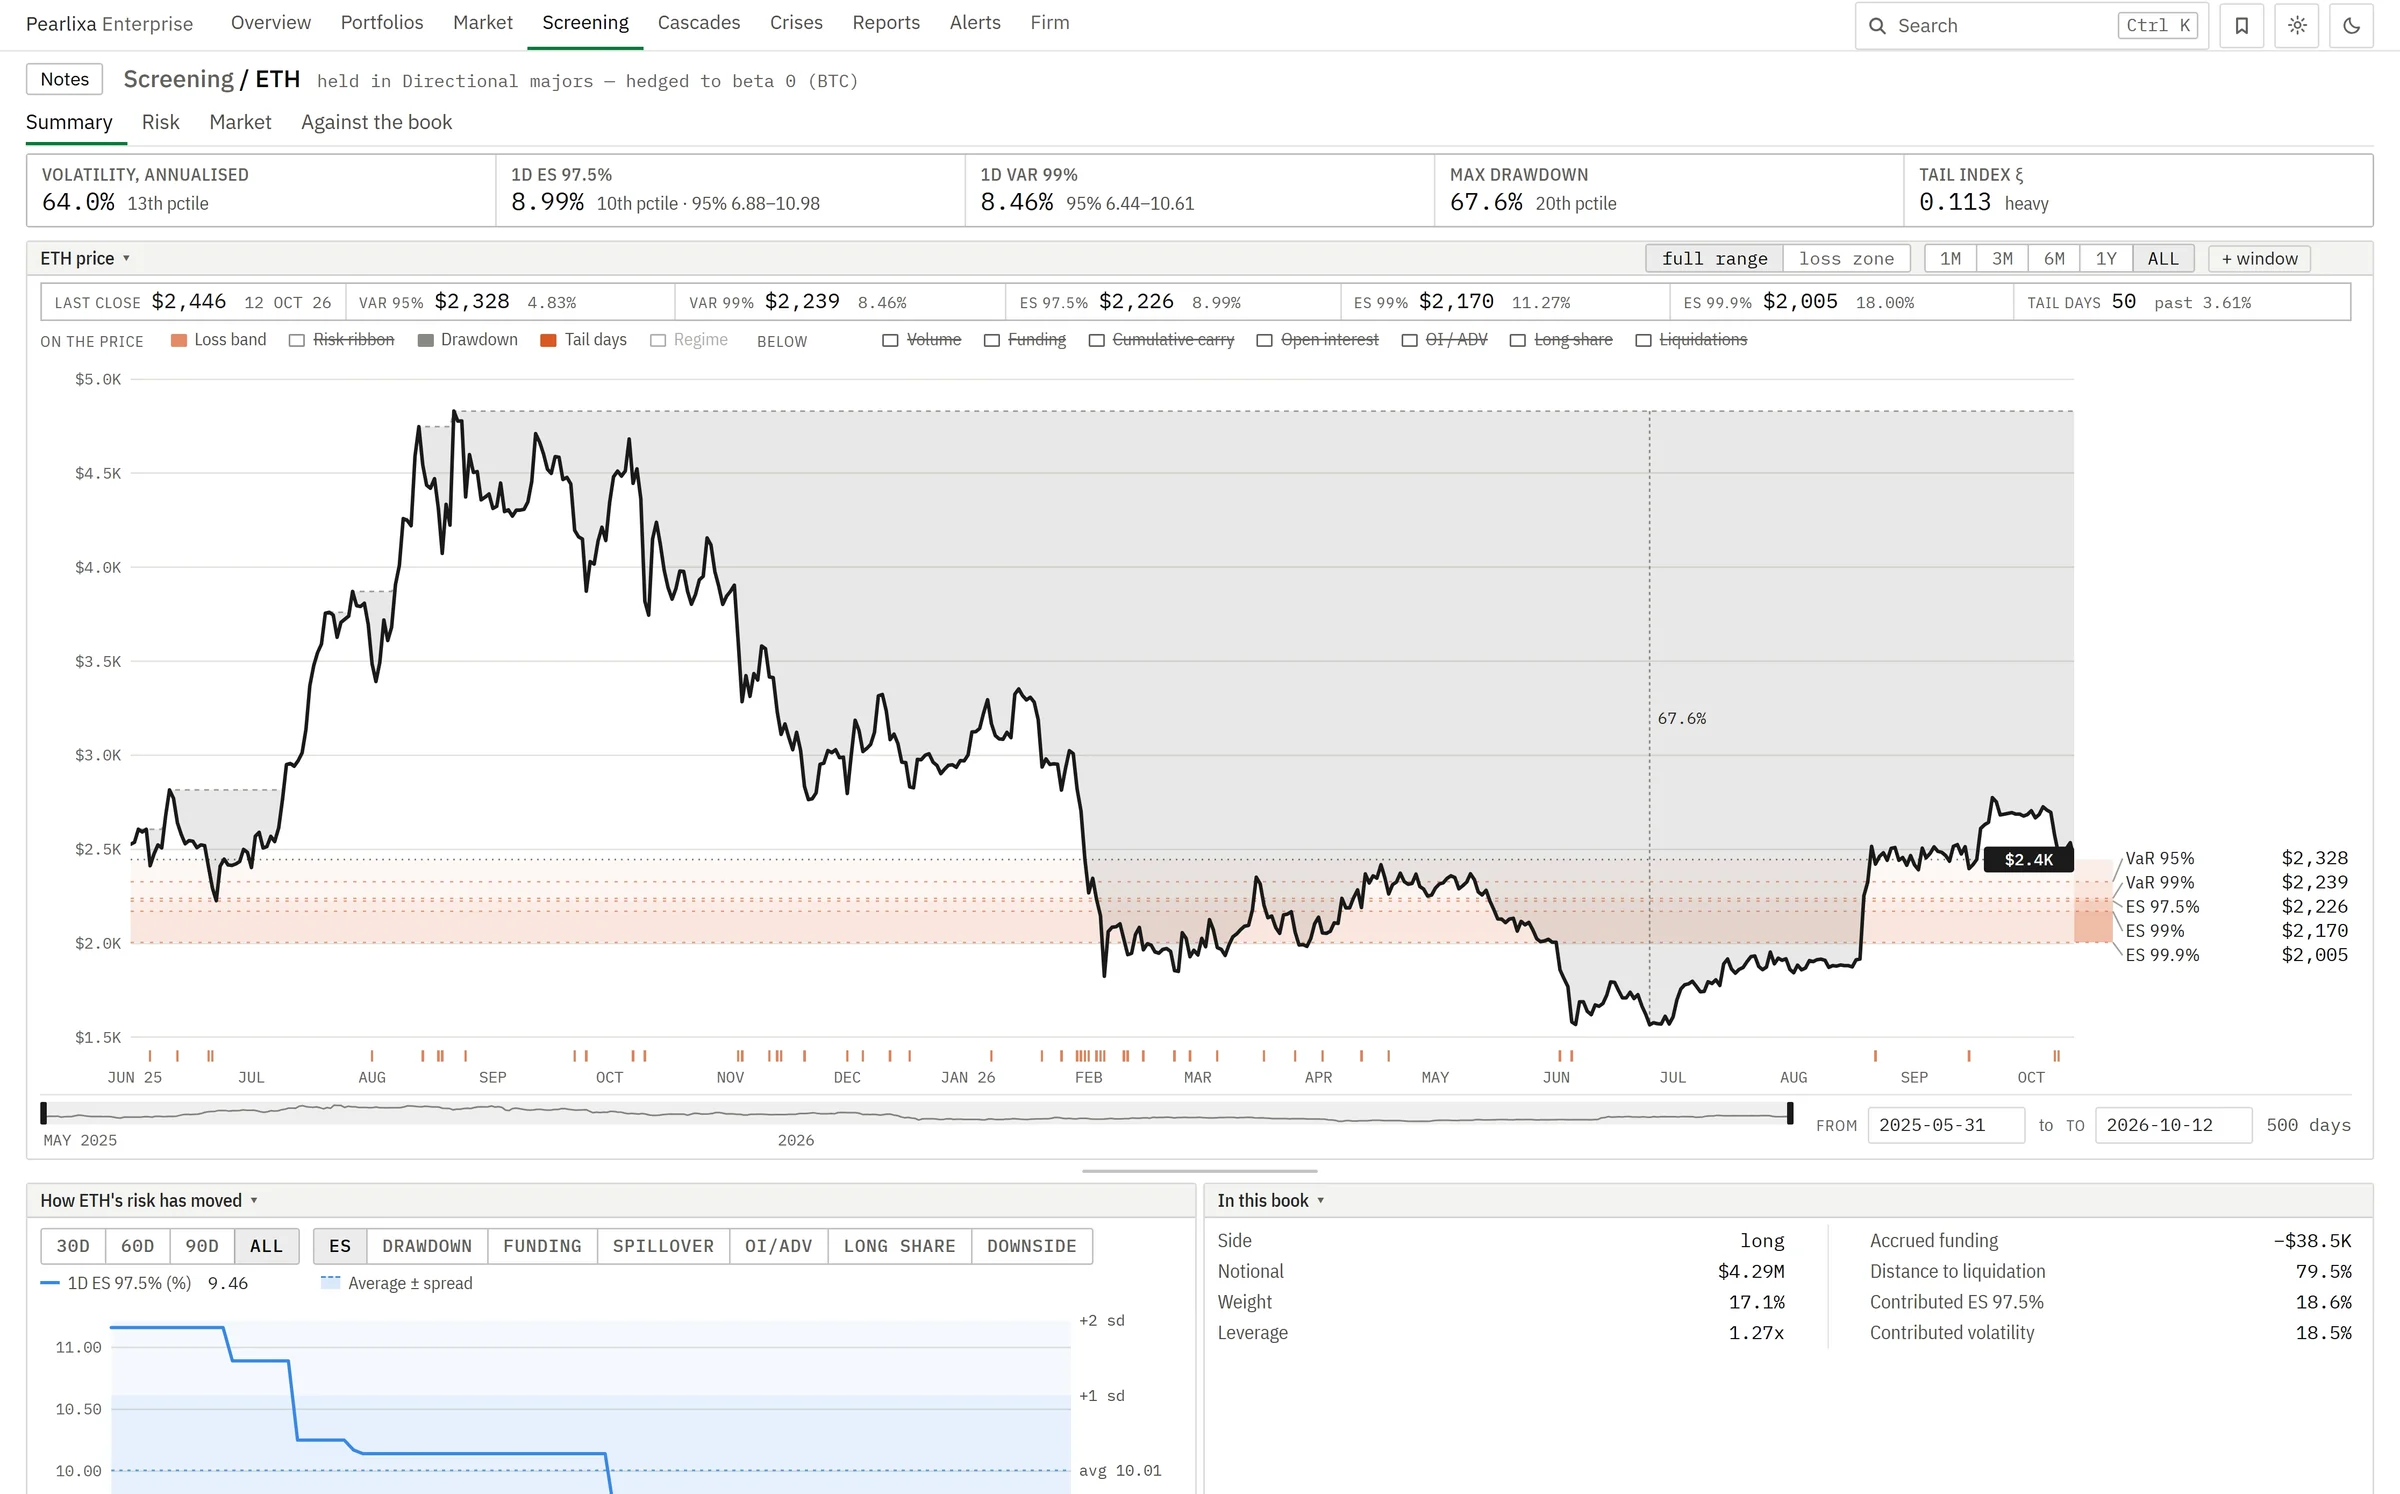
Asset analysis for crypto portfolios.
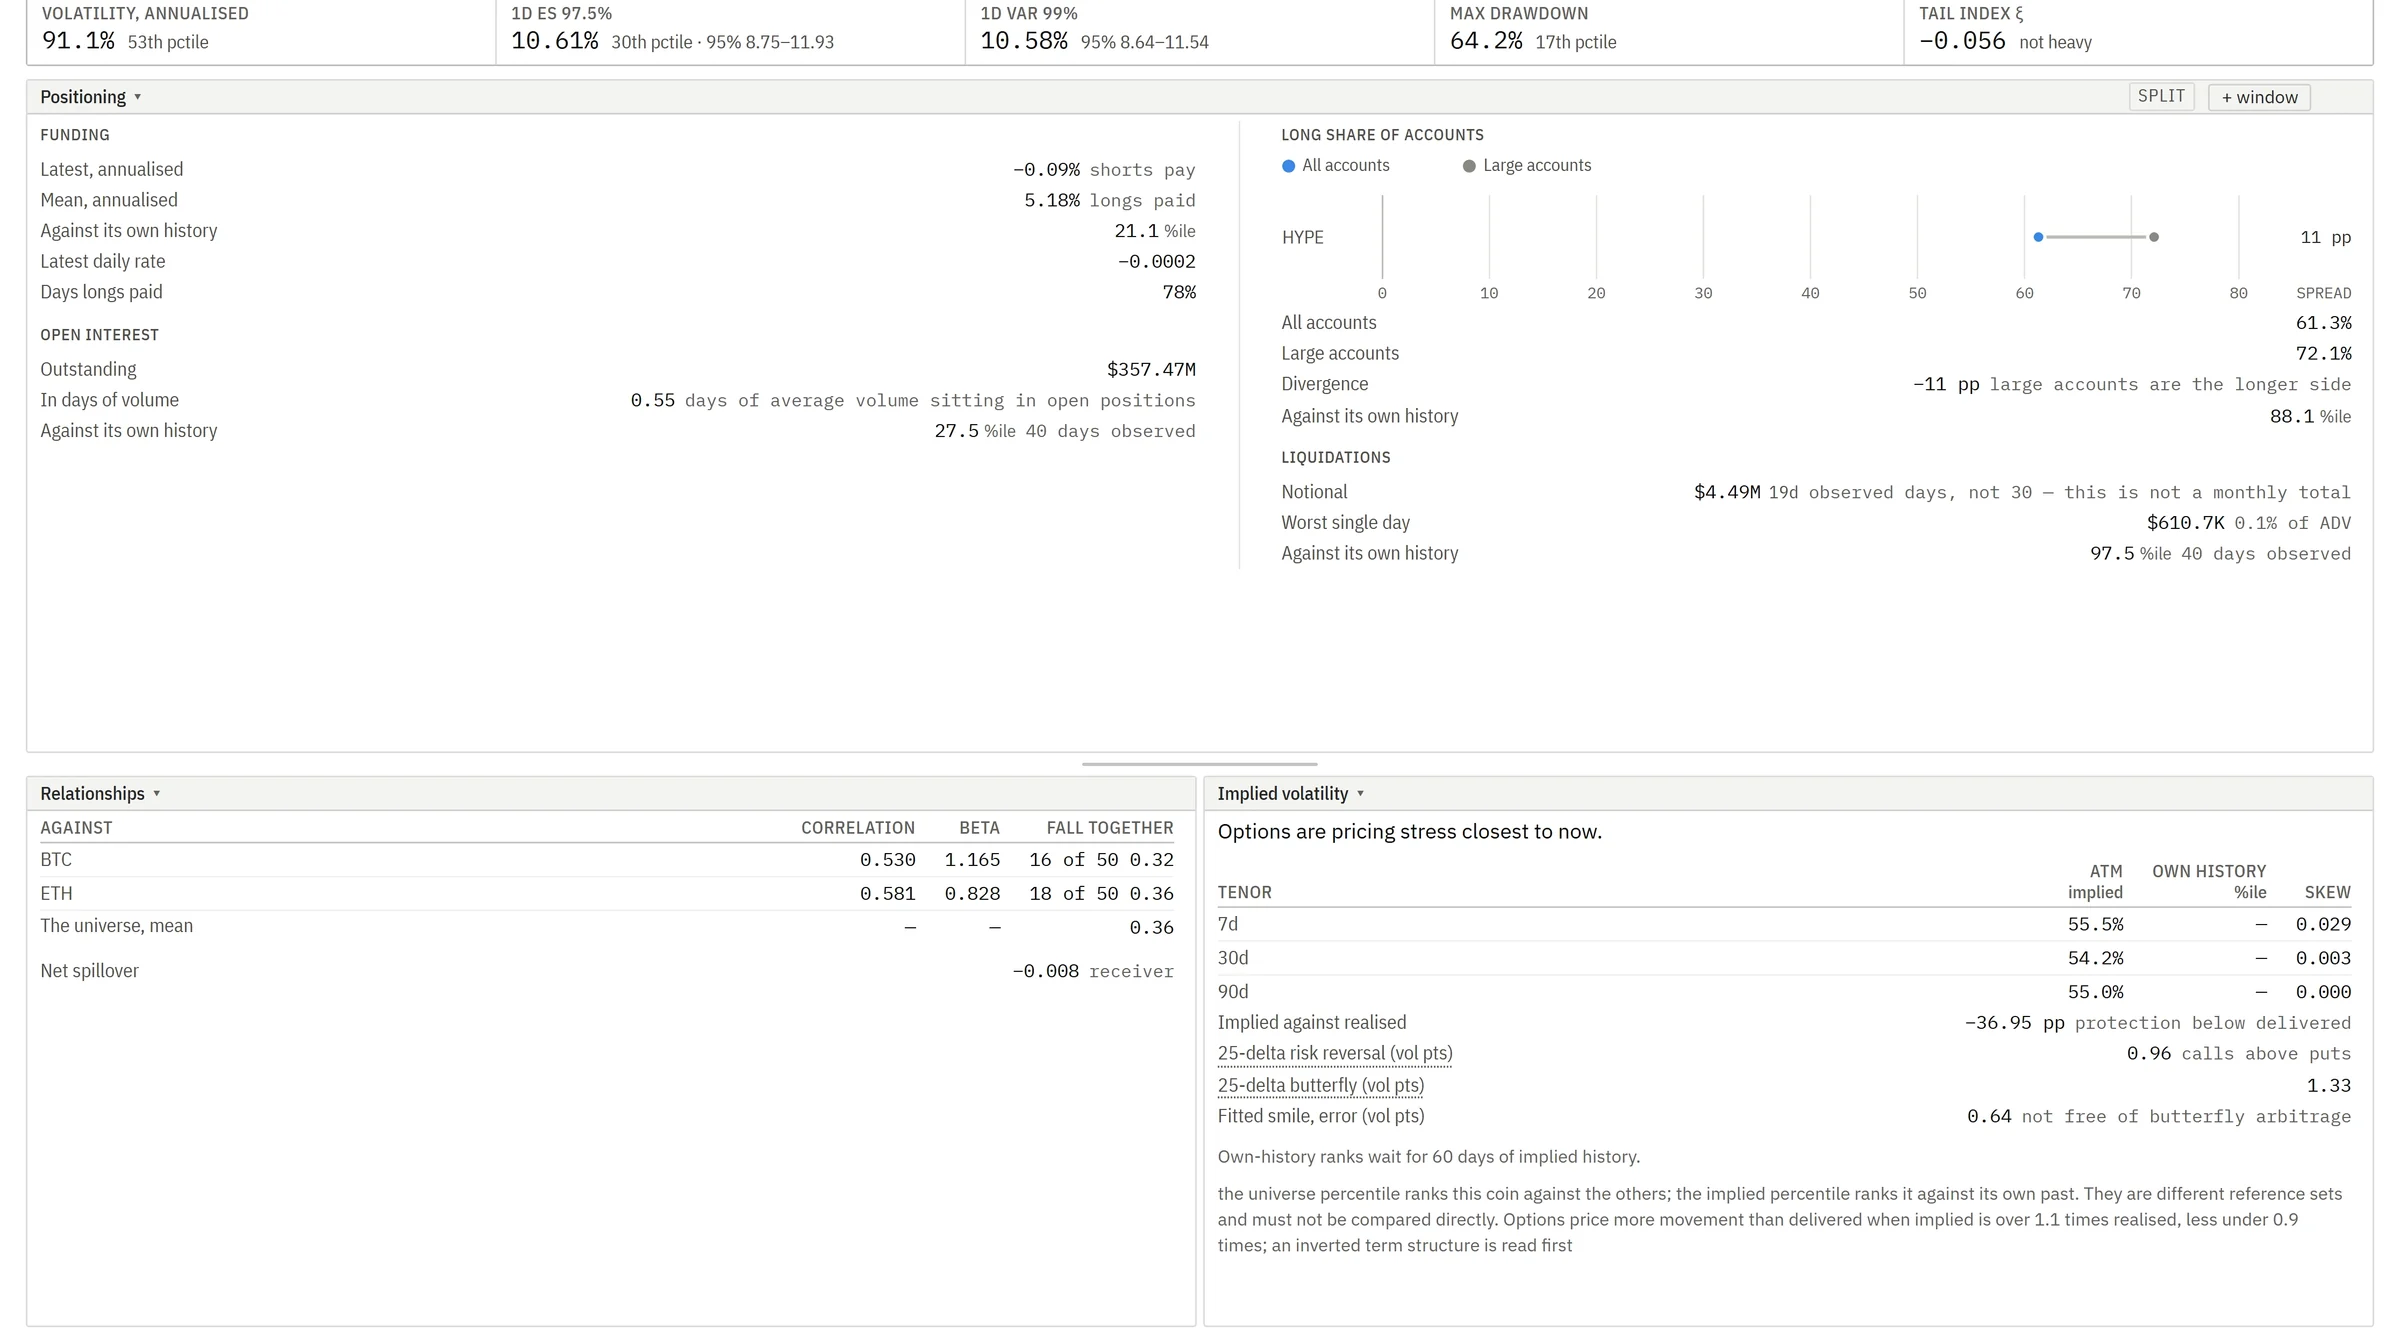
Pearlixa Assets measures each perpetual market on its own: realised and forecast volatility, how heavy its tail is, its worst drawdown, what it costs to leave at size and the funding a long pays to hold it. Each measure is ranked against the other markets, never combined into a score.
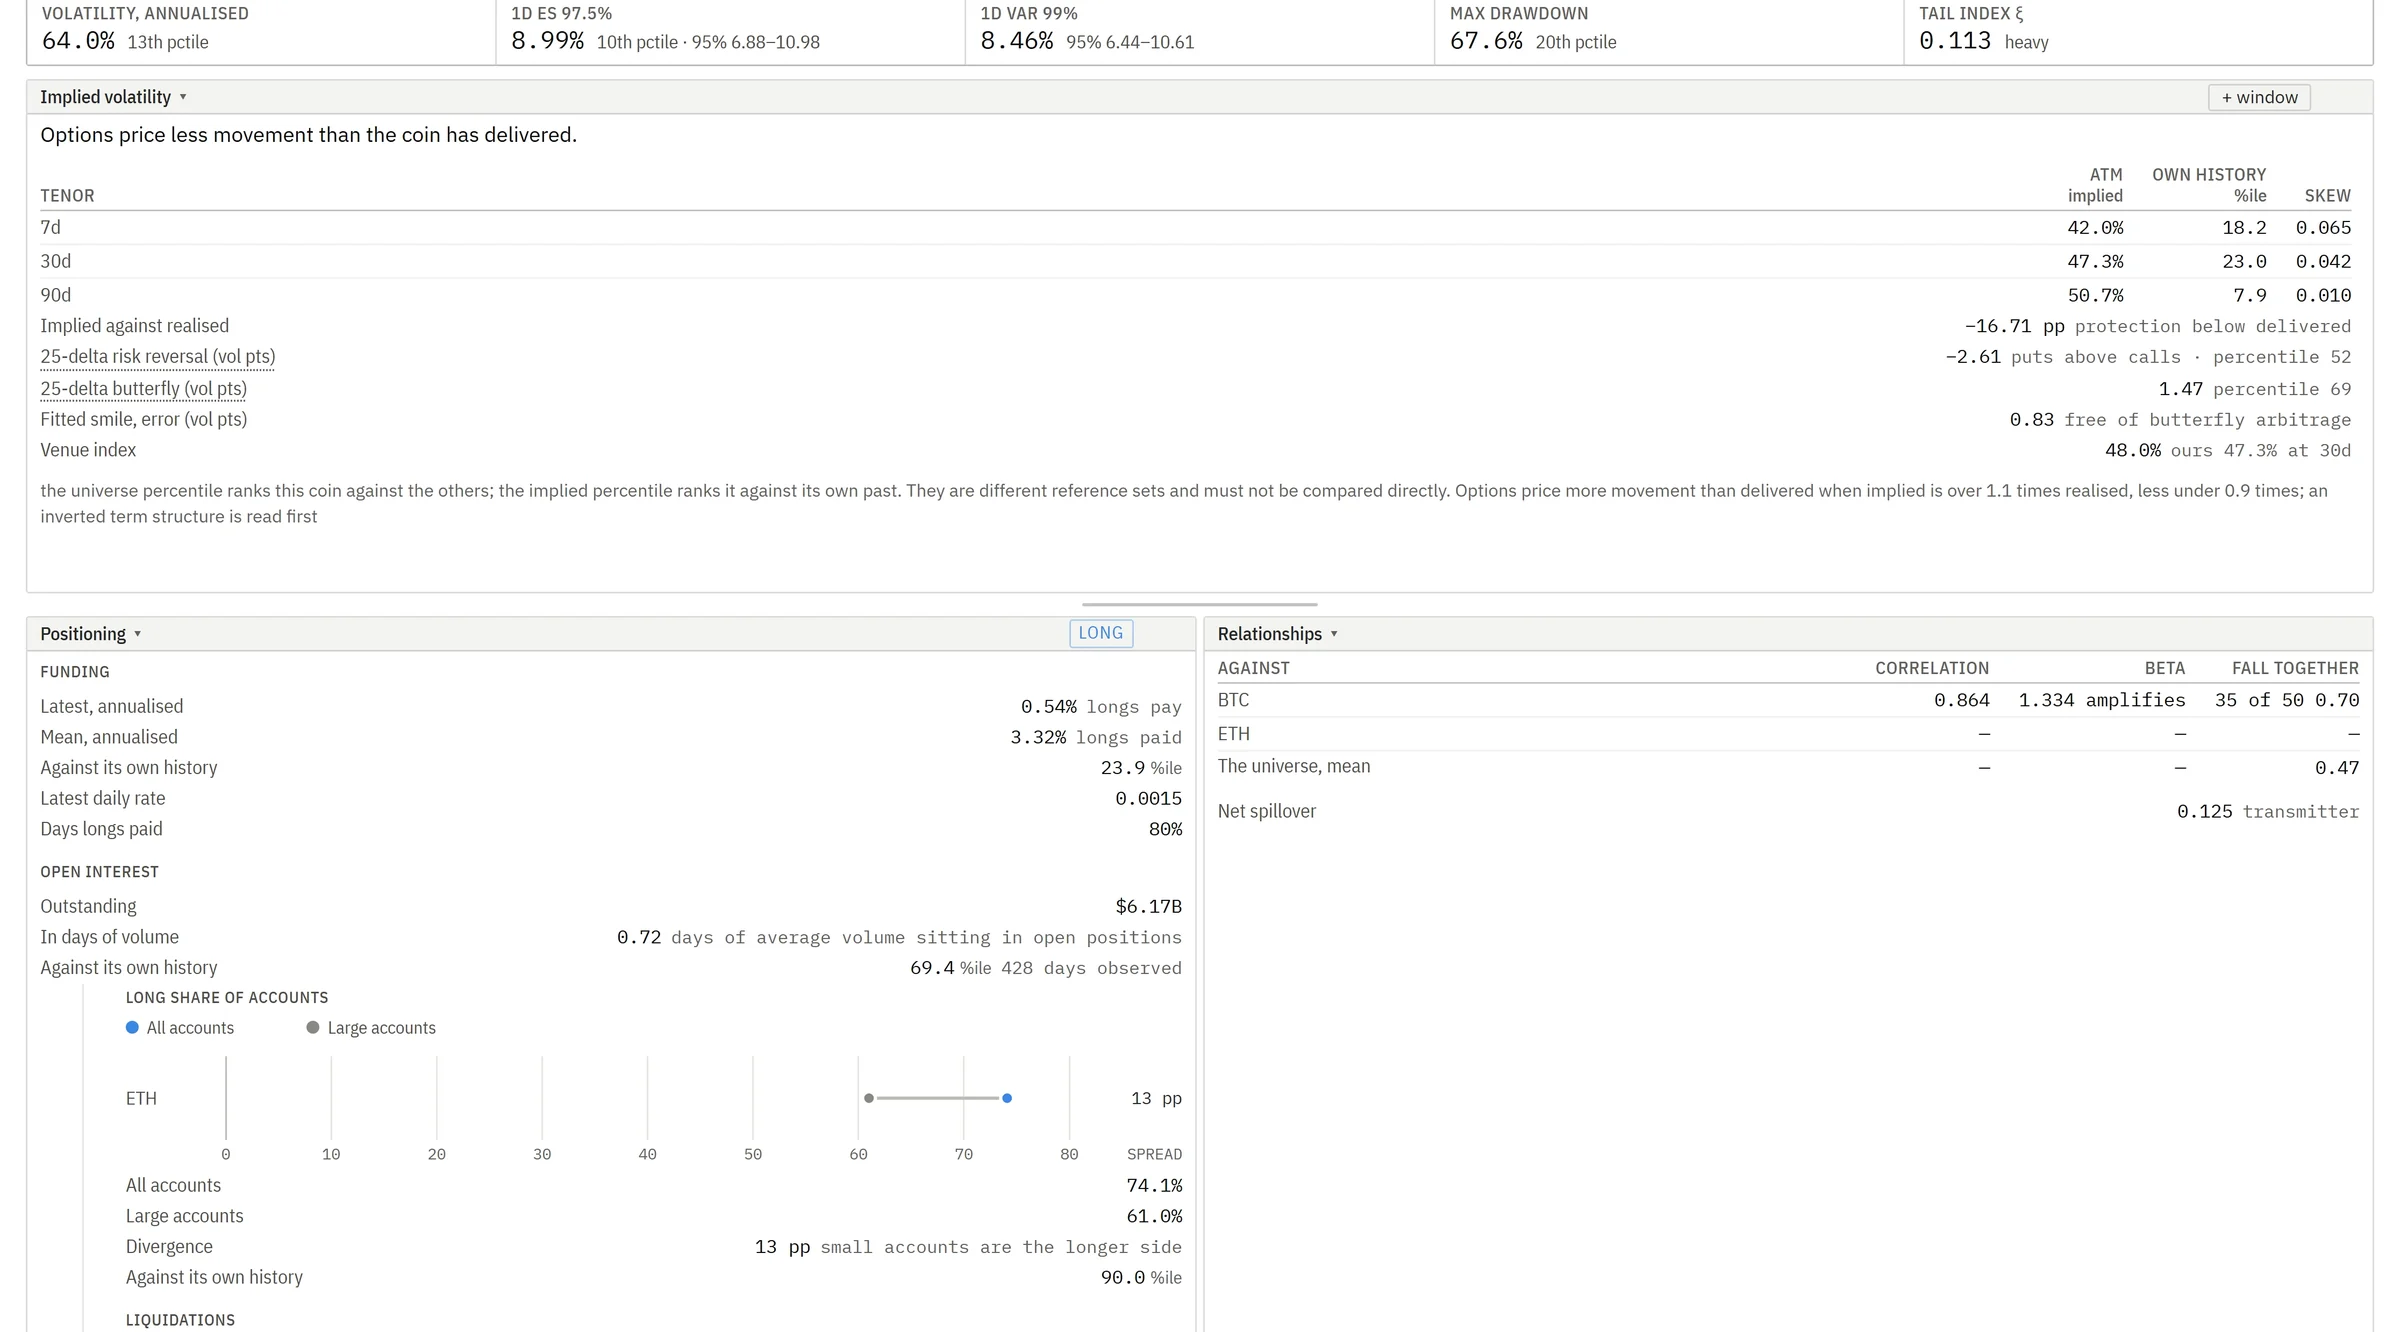
Positioning comes from what the exchanges report: funding, open interest, liquidations and the share of accounts that are long, for all accounts and for the largest, each against its own history. Where an asset has a listed options market, its implied volatility is set beside what it has delivered.
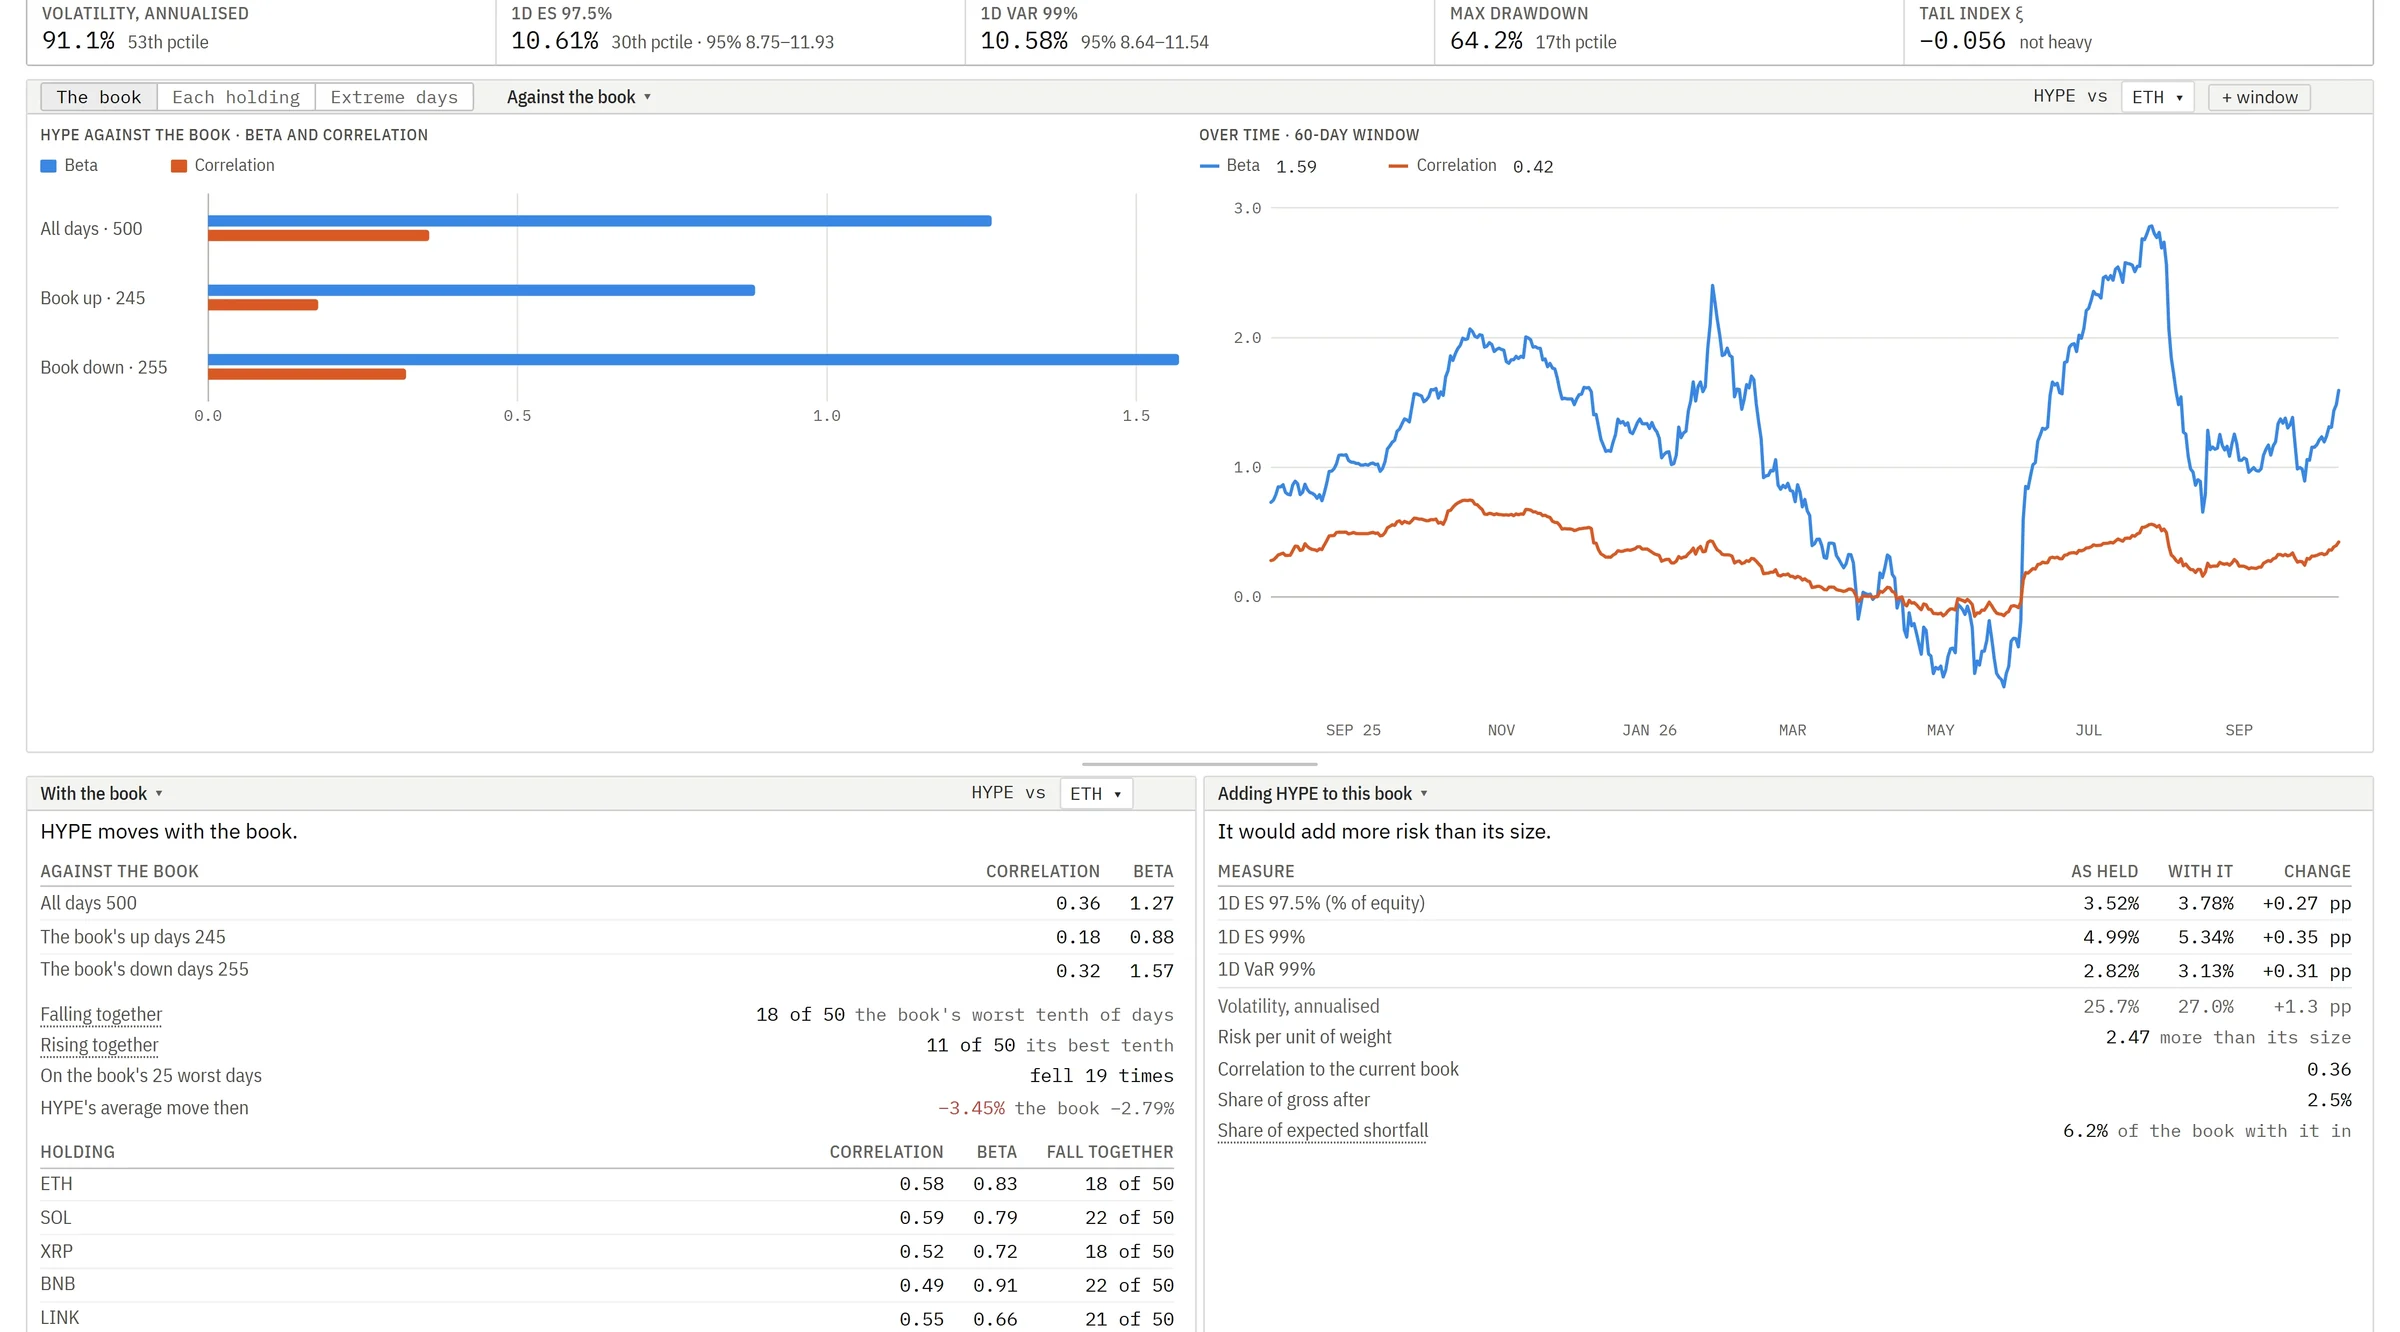
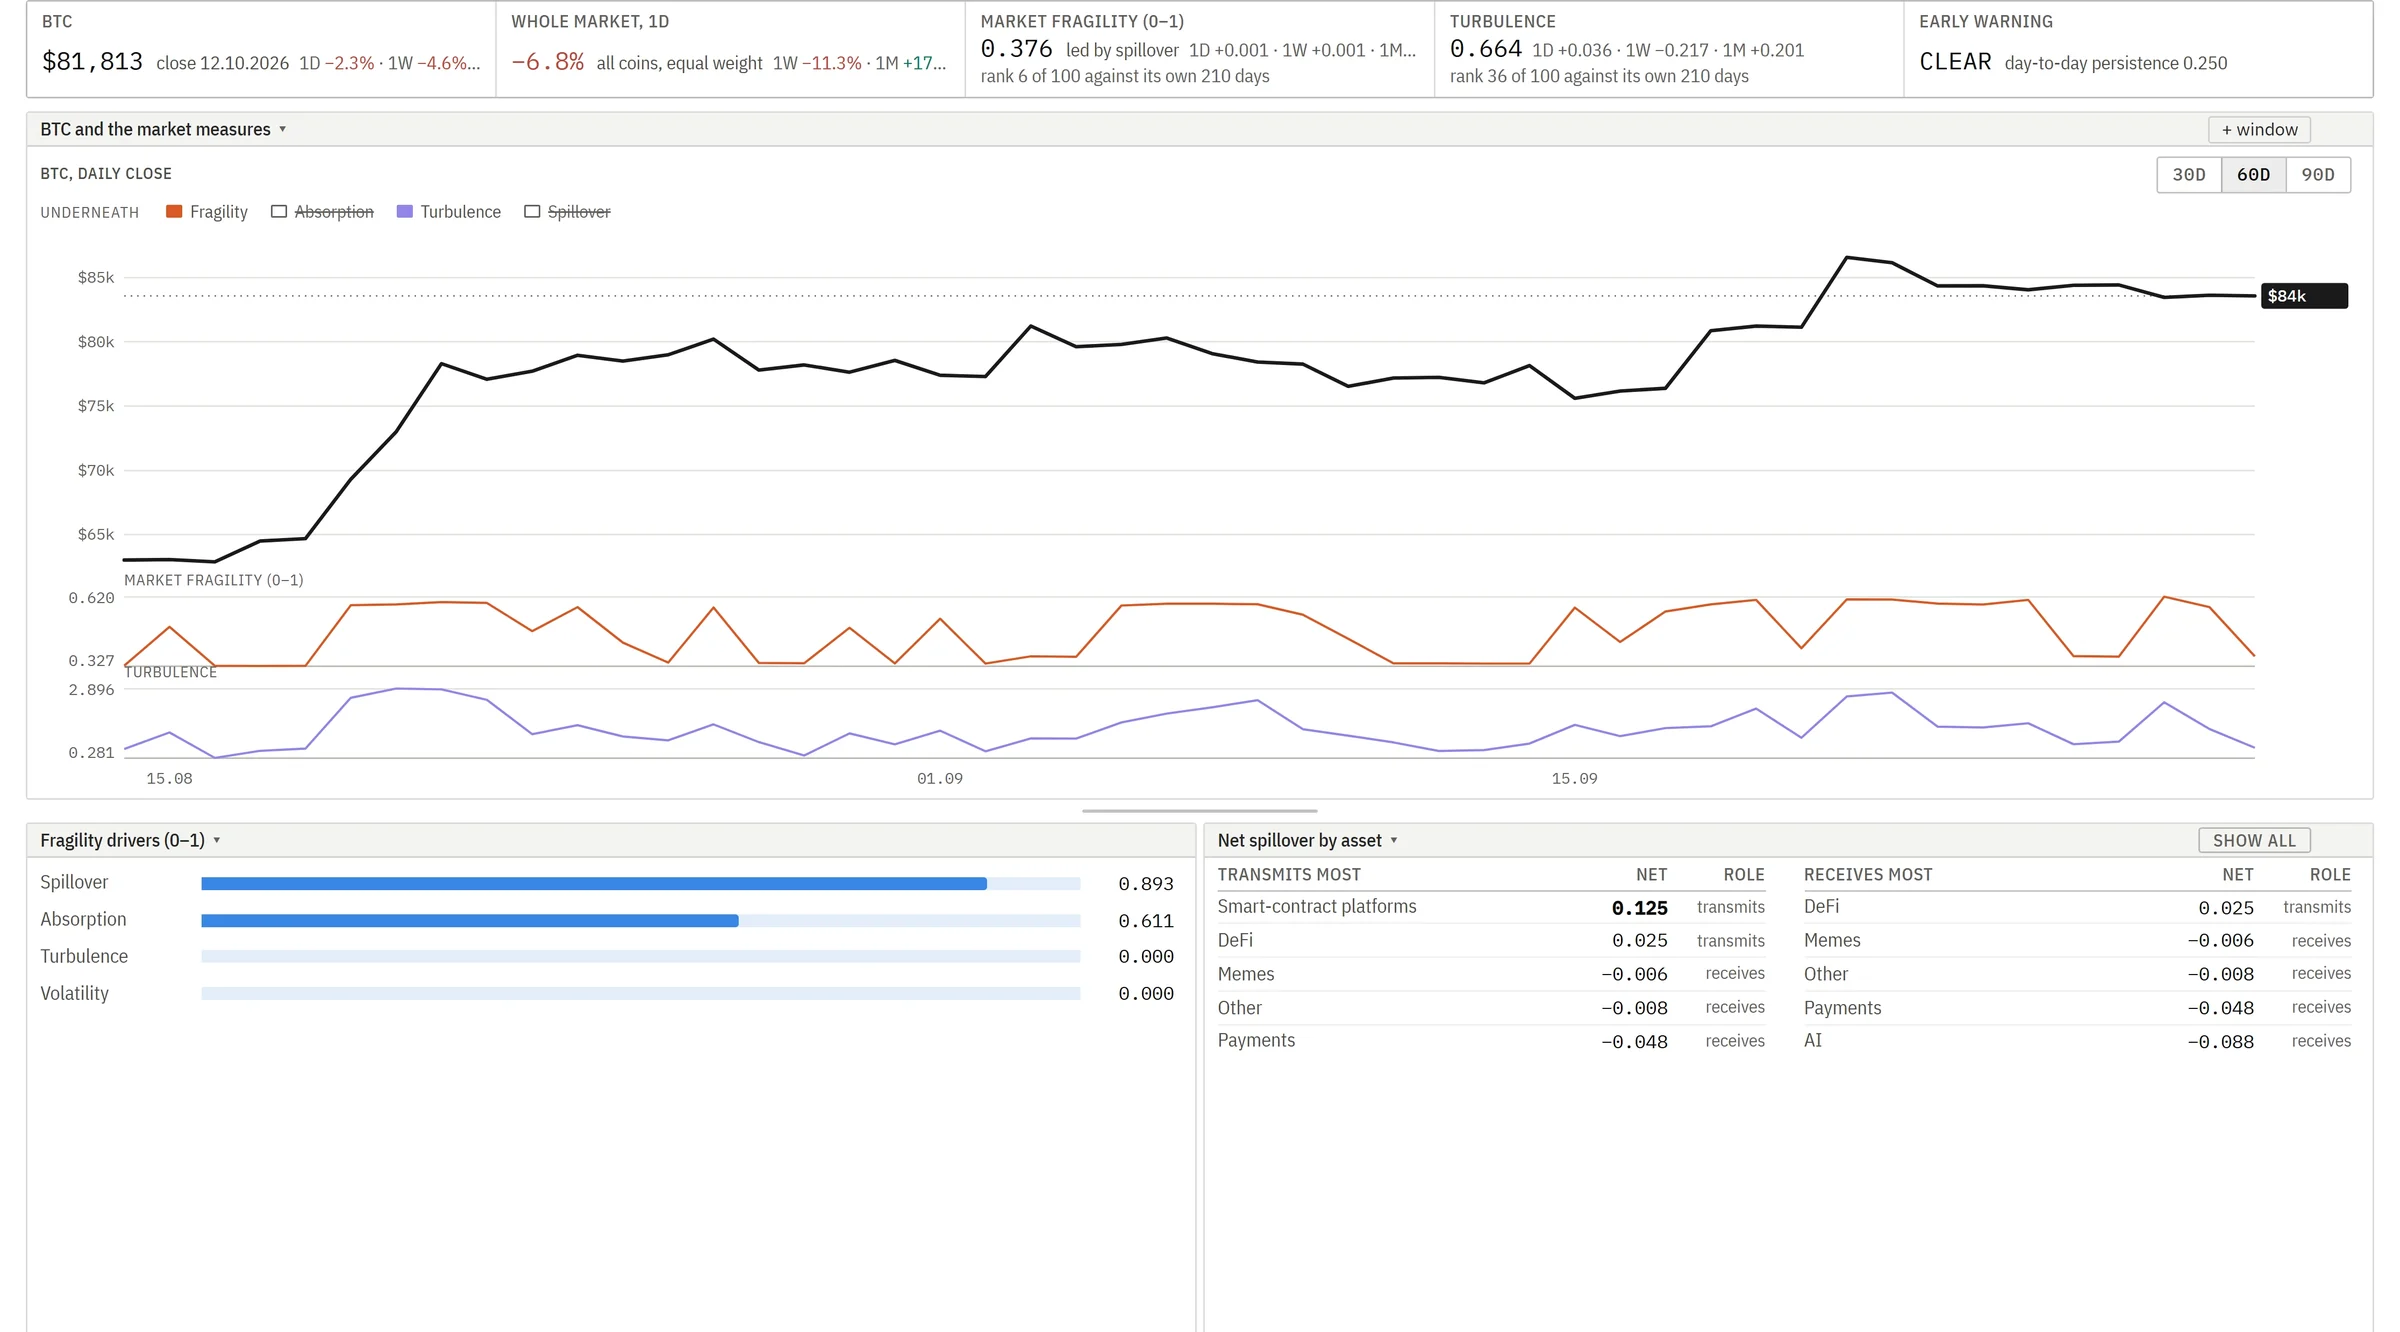
Inside a portfolio, each asset is read against what is already held: what adding it would do to the risk, how it moves on the portfolio's worst days, and its share of the risk where it is held. The market page shows how fragile the market as a whole is each morning, and the cascades page measures past liquidation cascades by severity, with how far each asset fell in them and the depth of its order book.
Each asset, and the market around it.
Seven views from the screening, asset and market pages, shown on a demonstration portfolio.
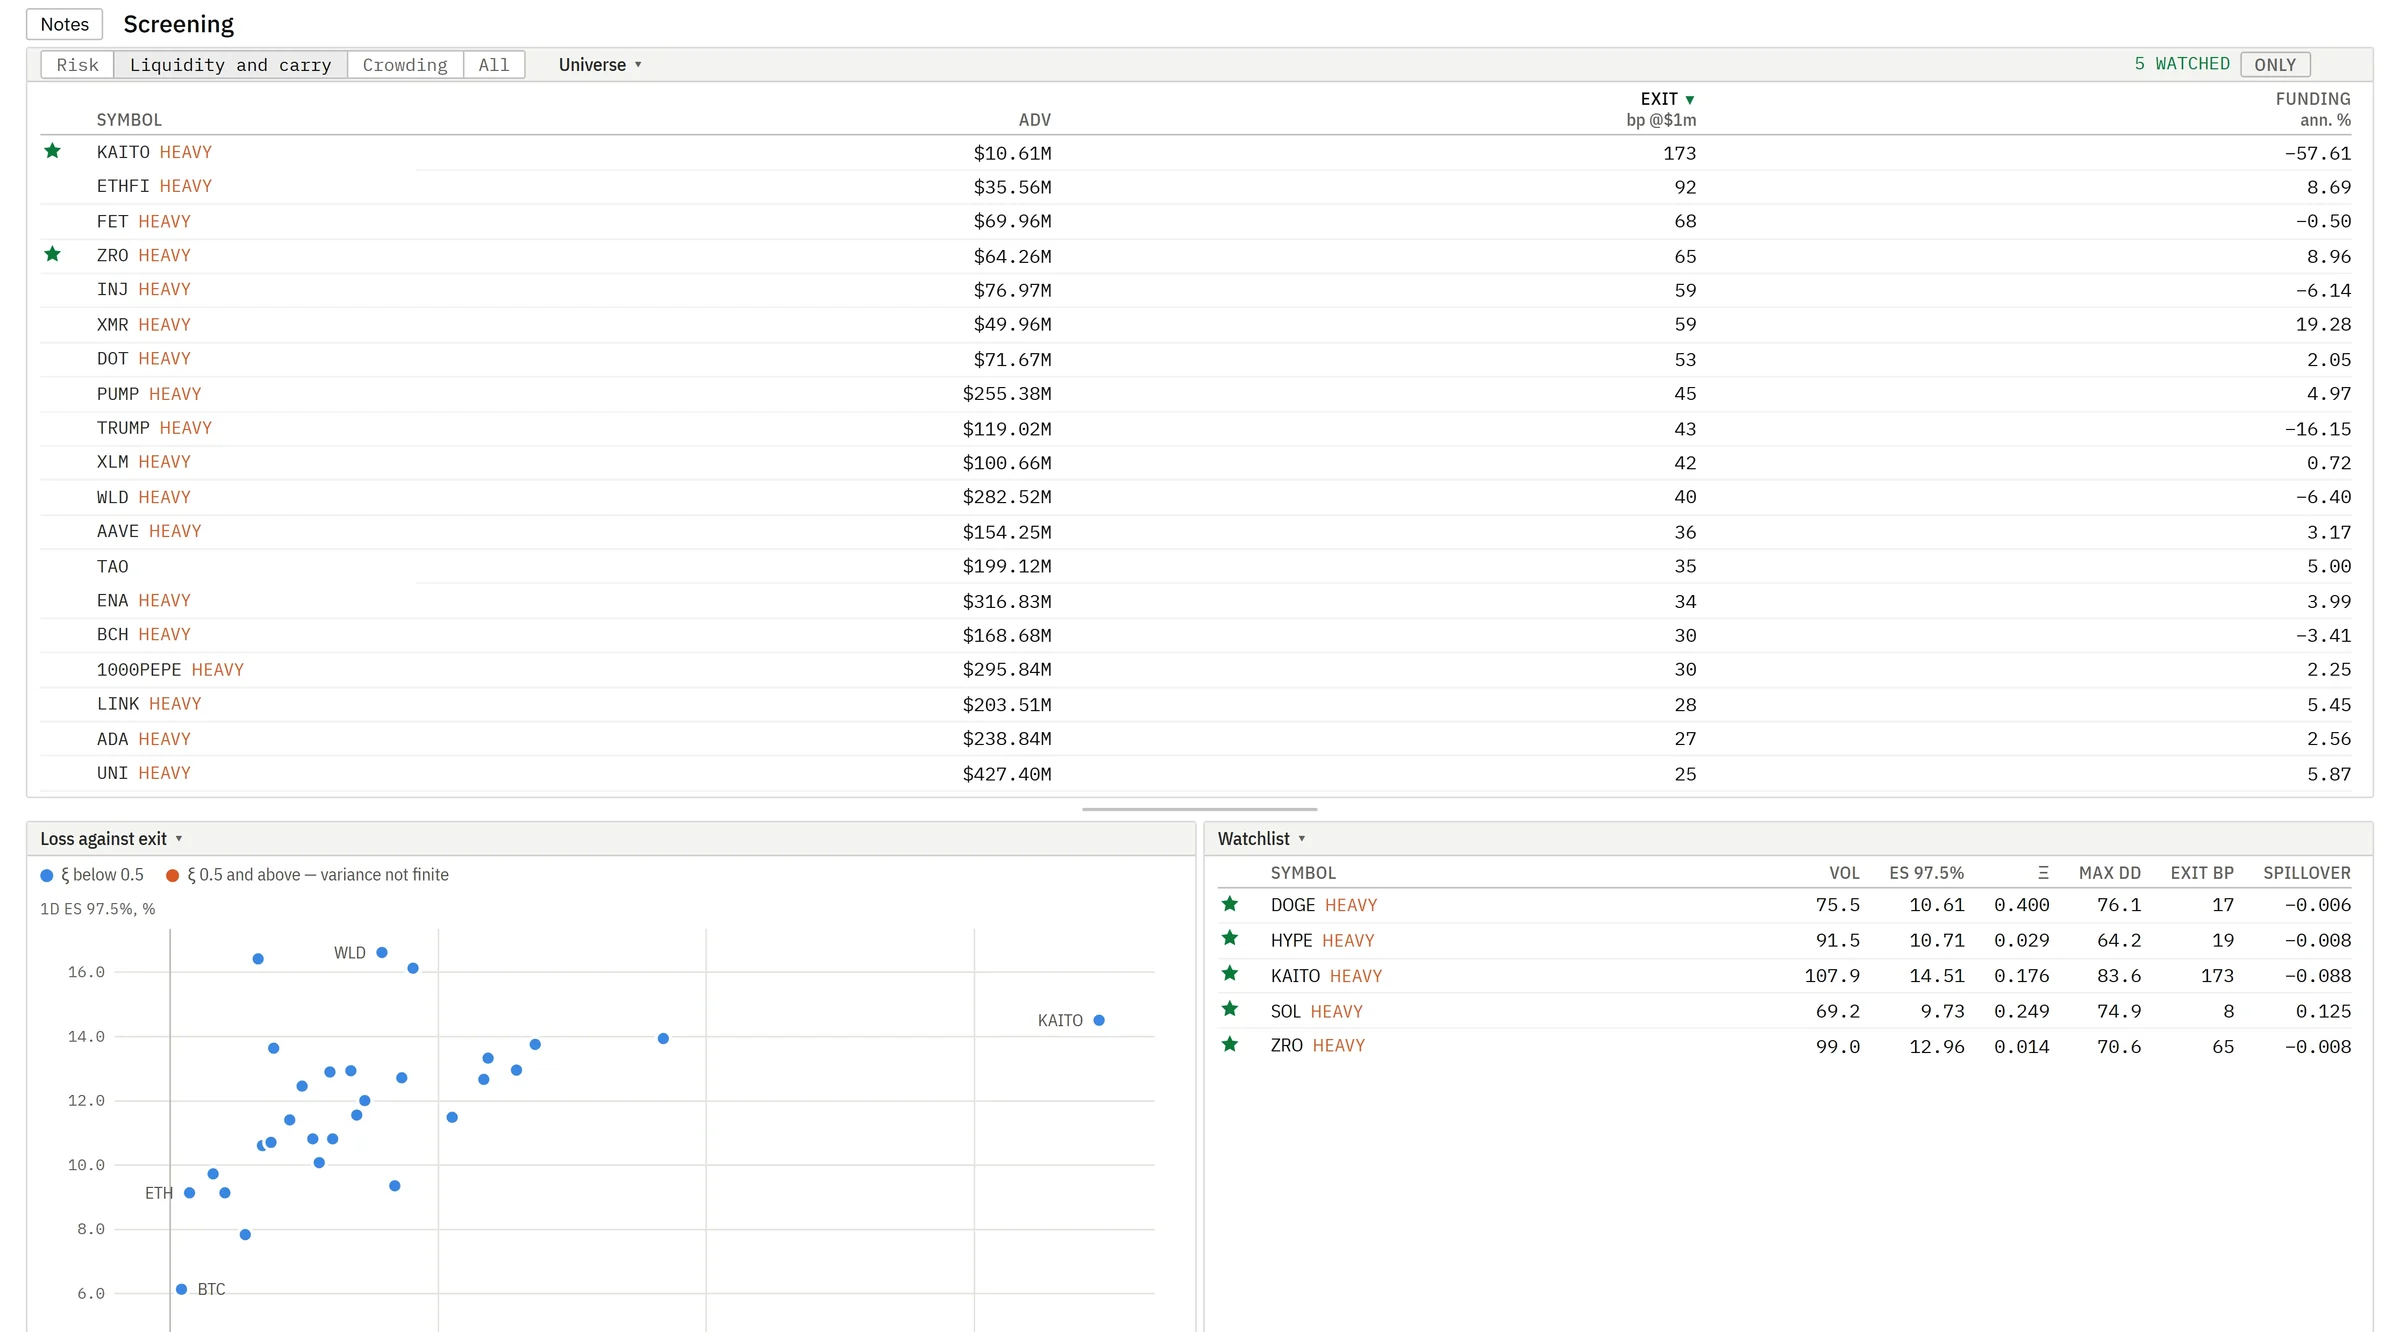
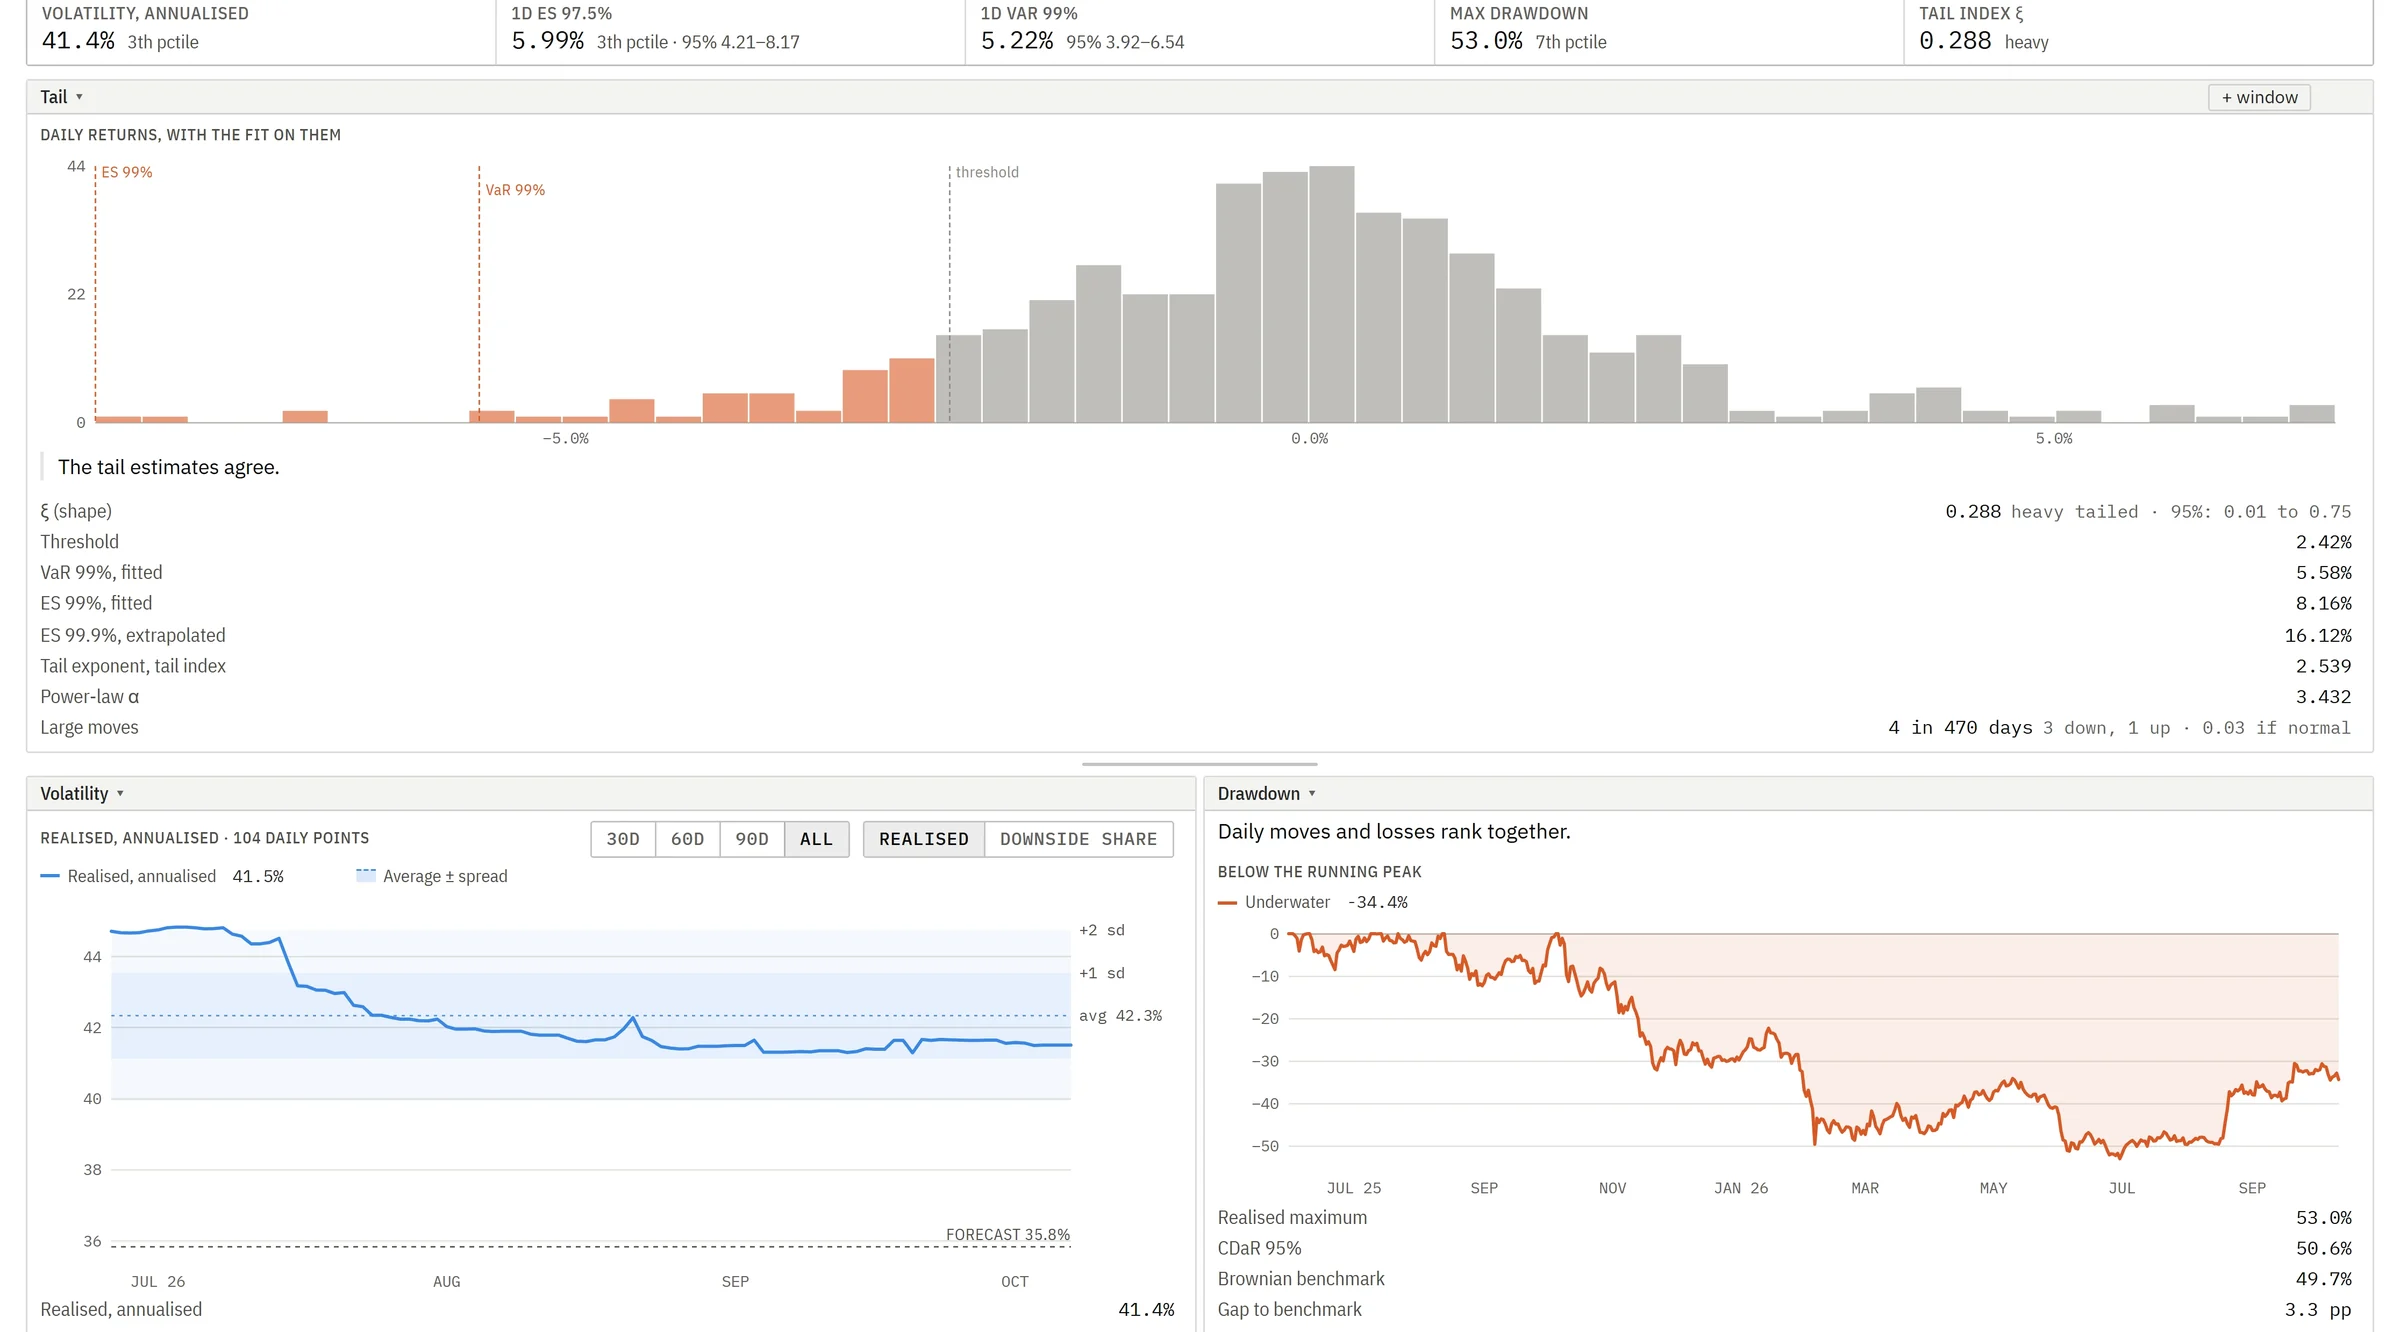
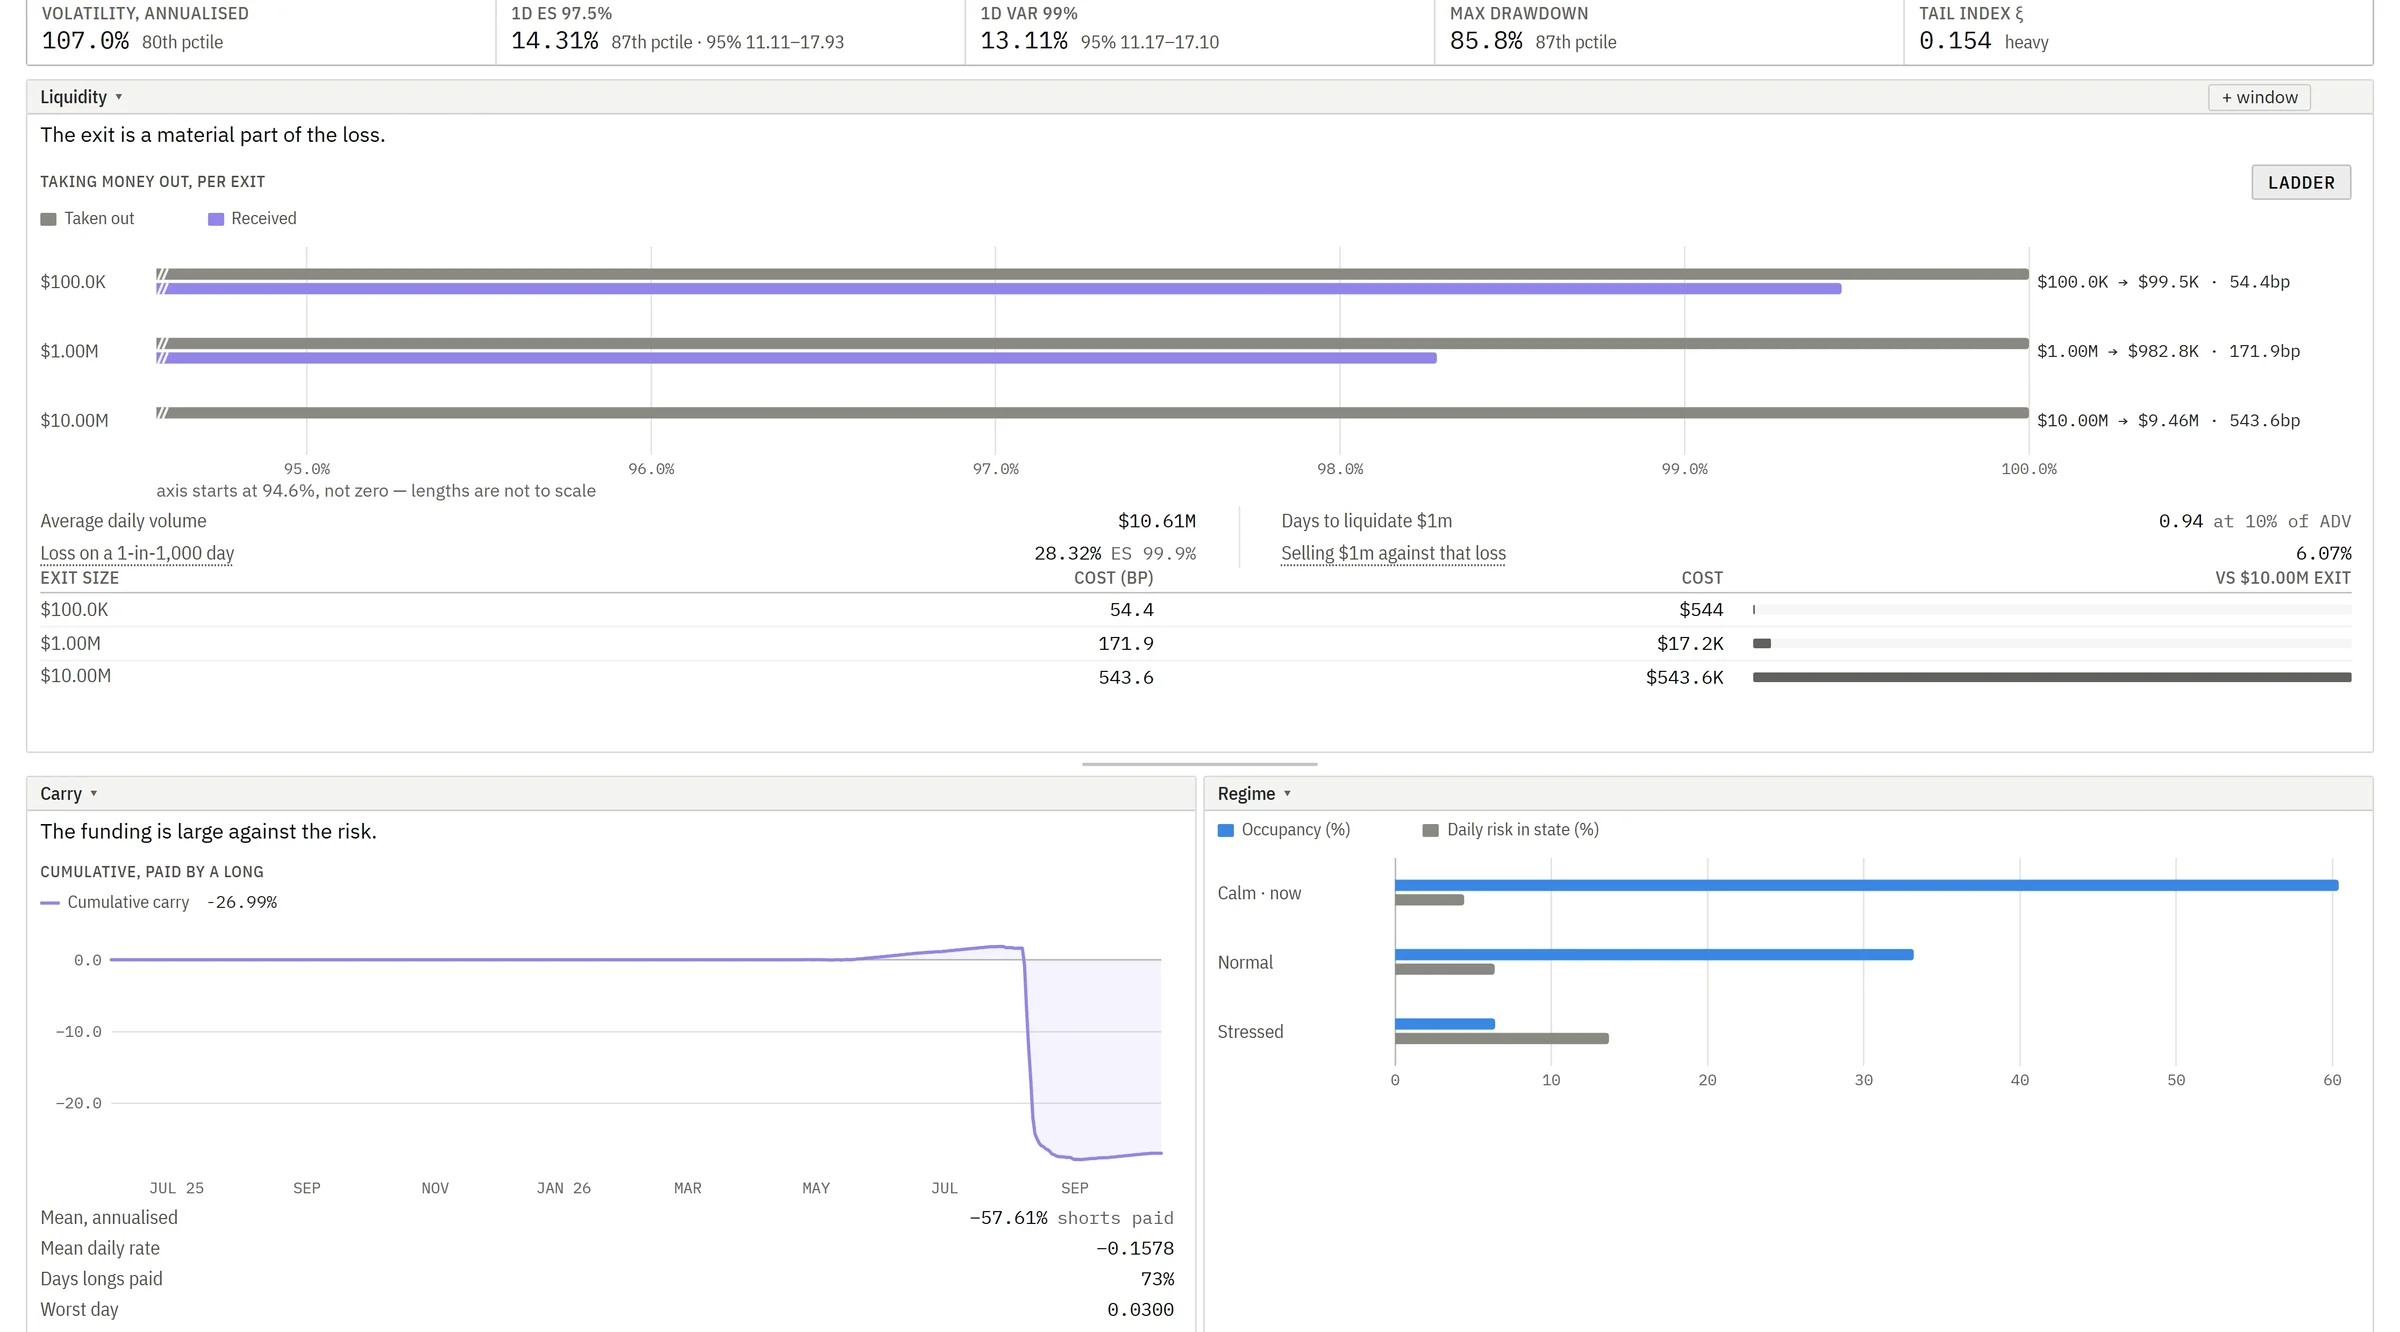
Every market on one screen
Every perpetual market compared on risk, on liquidity and carry, or on crowding. Any column sorts, and a watchlist keeps the names the fund follows.
Cost of exiting $1 million in the least liquid market on the screen.
Everything Pearlixa Assets covers.
Each asset on its own
- Volatility, realised and forecast
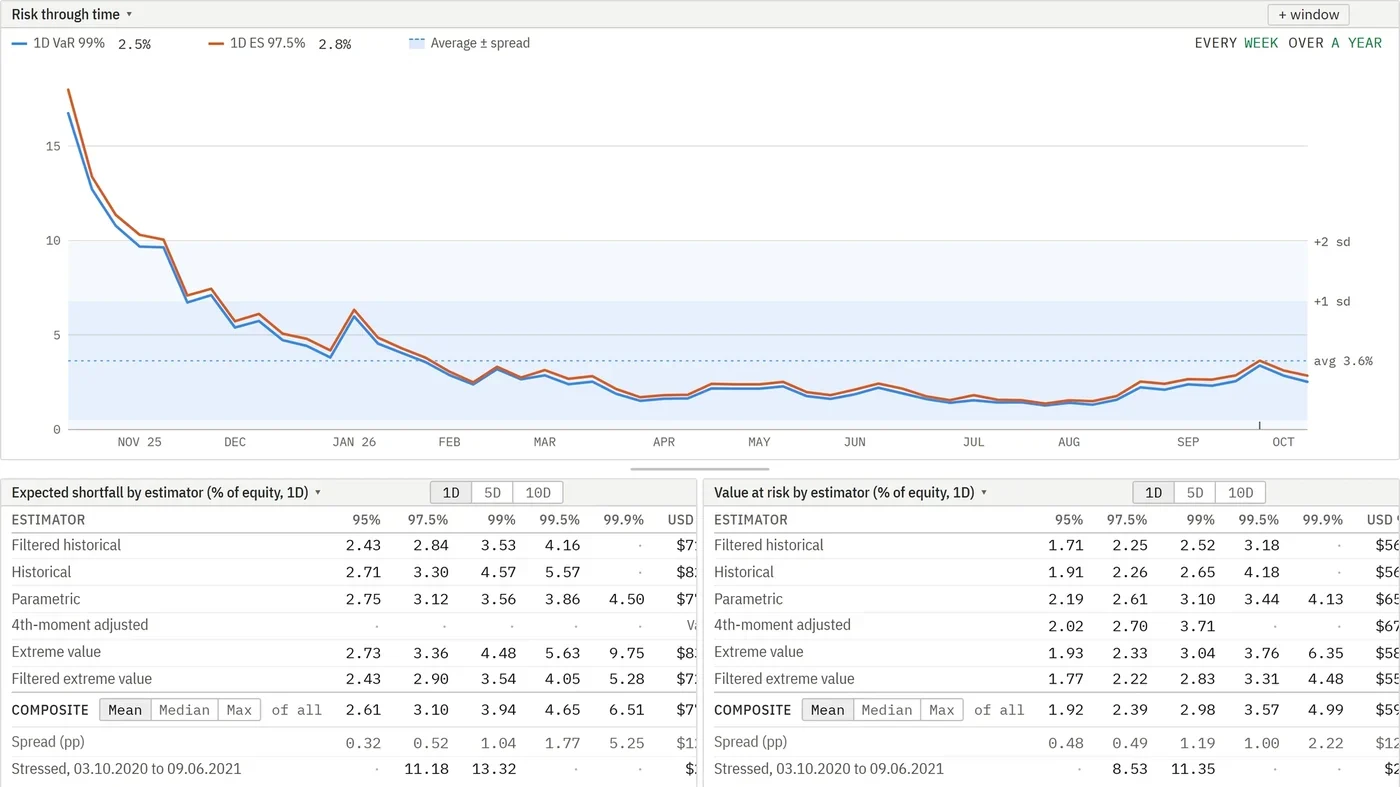
- Value at risk and expected shortfall
- A fitted extreme-value tail, with the interval on its shape
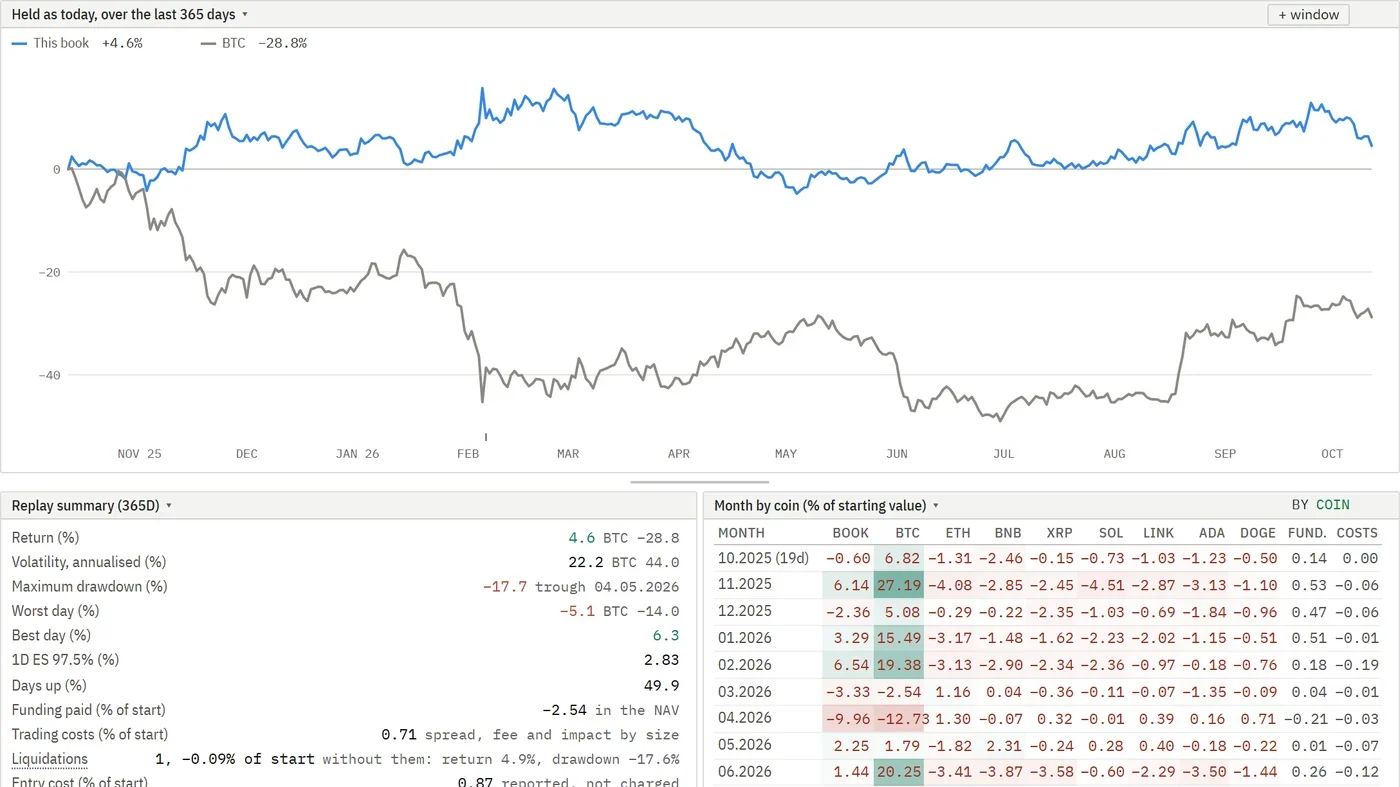
- Drawdown against what volatility alone would explain
- Each ranked against the other markets, never combined into a score
Liquidity and carry
- Exit cost at $100,000, $1 million and $10 million
- Days to sell $1 million at 10 percent of volume
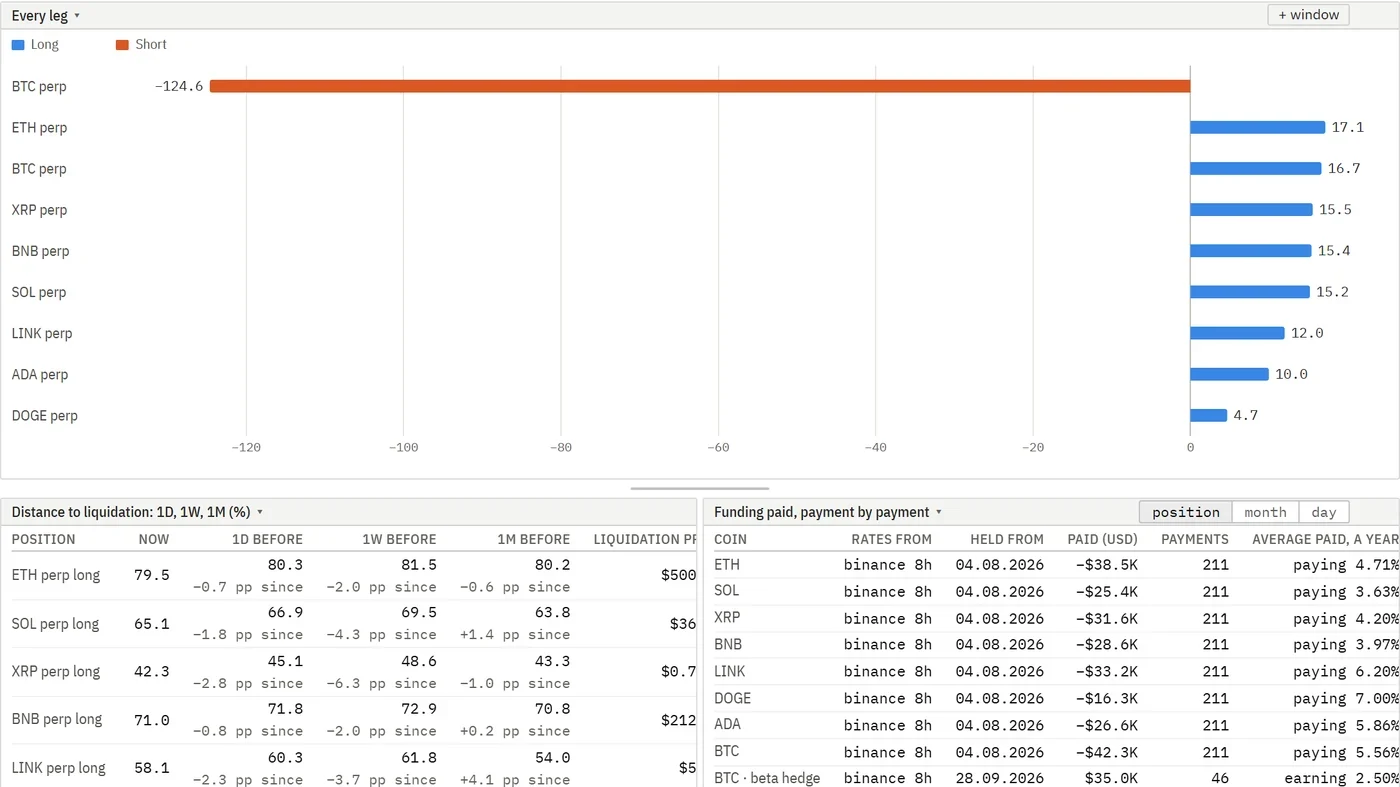
- Funding paid by a long, by day and in total
- Carry against volatility
- Order-book depth, and its low in a liquidation cascade
Crowding
- Funding against its own history
- Open interest, in days of volume
- Liquidations, with the window they cover
- Long share of all accounts and of the largest
Options
- Implied volatility at 7, 30 and 90 days
- Skew and term structure
- Implied against realised
- For assets with a listed options market
Against the portfolio
- Its share of the risk, where it is held
- The portfolio's risk with it added
- Correlation and beta on the portfolio's up and down days
- How it moved on the portfolio's worst days
The market
- Fragility, absorption, turbulence and spillover
- The assets that pass stress on, and those that take it in
- An early warning
- Every asset on each measure
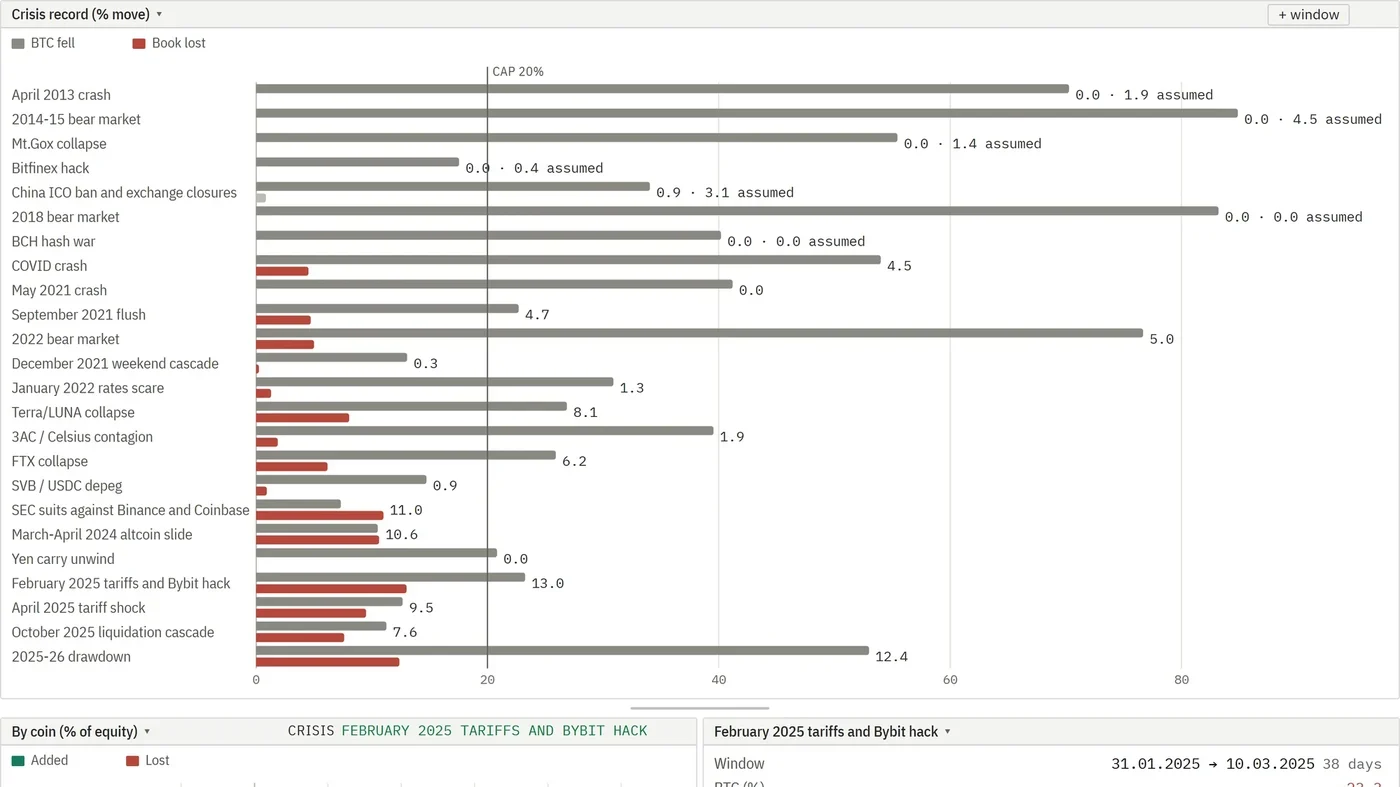
- Past liquidation cascades, by severity
Every module reads the same portfolio.
Start with a call.
A short conversation about how your fund assesses the assets it holds or is considering today, followed by a live demo of Pearlixa Assets.
Book a call