How much a portfolio can lose, and where the risk sits.
Value at risk and expected shortfall for every portfolio, every day, traced to the positions, sectors and factors behind them.
Risk analytics for crypto portfolios.
Pearlixa Risk measures how much a fund's crypto portfolios could lose, and where that loss would come from. It works on the positions the fund holds, spot and perpetual futures with their leverage, funding and venue, and crypto ETFs and ETPs read through to the assets they hold. It is built for risk managers, chief investment officers and the committees they report to.
Value at risk and expected shortfall are computed under six estimation methods side by side. Filtered historical, which scales the past to today's volatility, leads every page, and the other methods stand beside it at one, five and ten days and over the most stressed 250 days in the record.
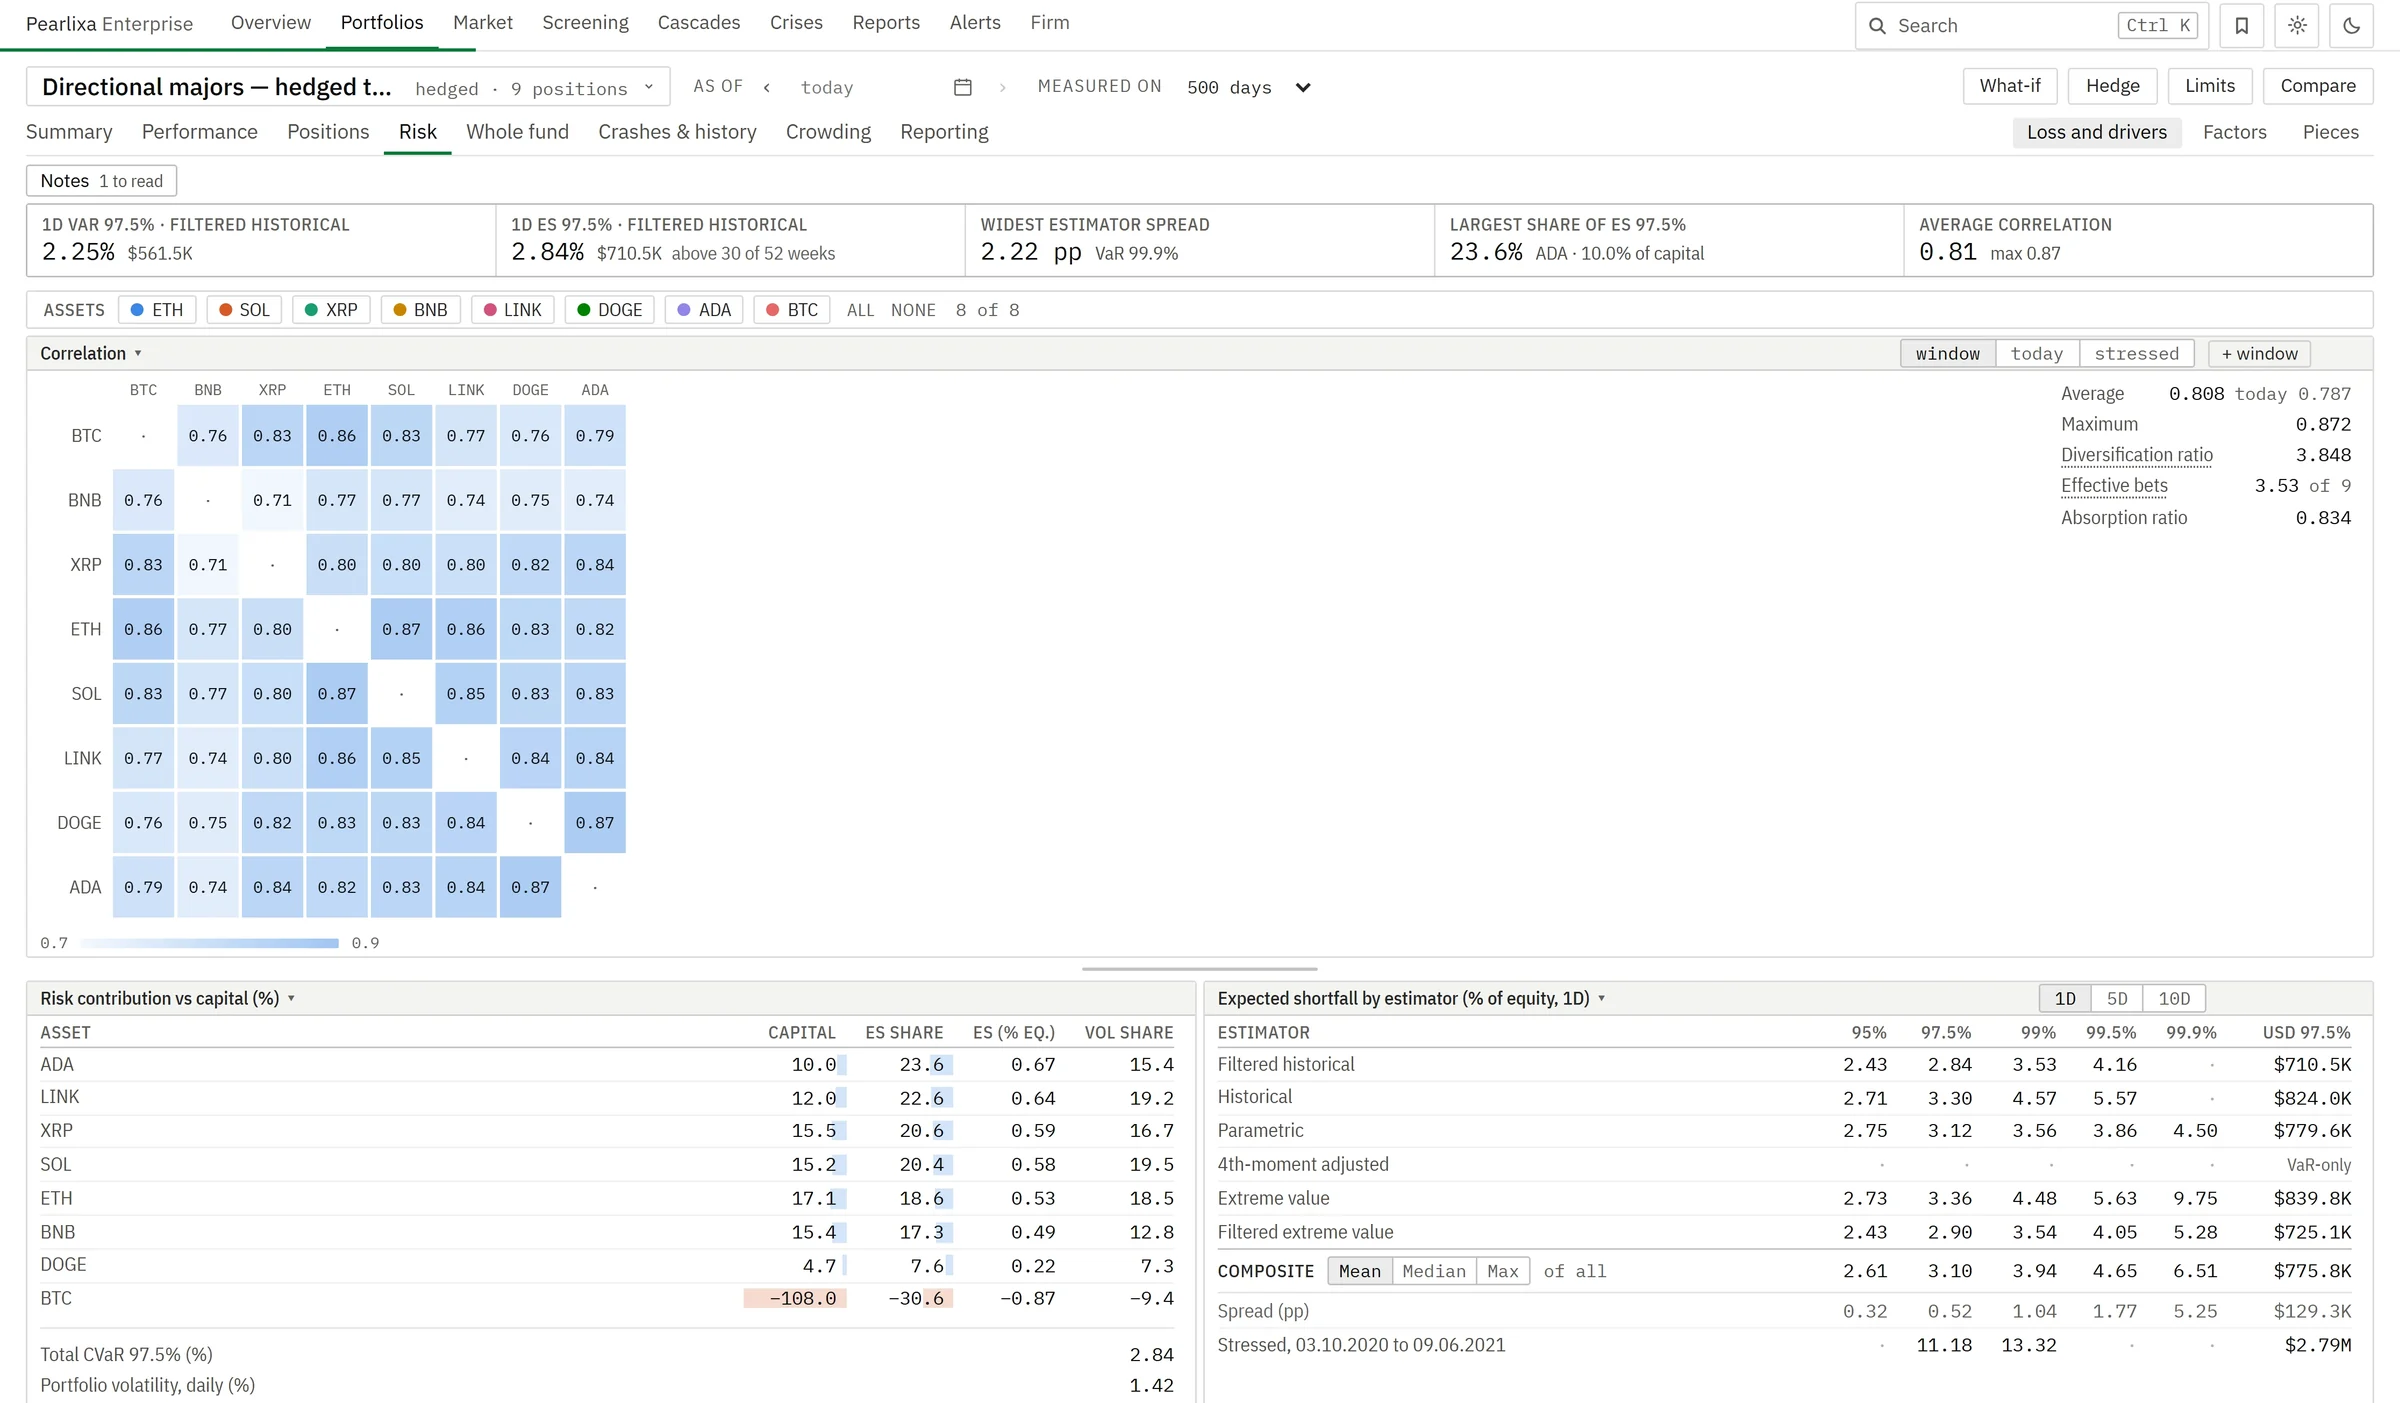
Each figure can be broken down by position, sector, venue or side, and behind the positions sit the factors they share and the pairs most likely to fall on the same day. Correlation is shown over the measurement window, as it stands today and as it was in stress, and a liquidity-adjusted value at risk adds what it would cost to exit each position.
The same figures go into the fund's reports, from the morning pack to the risk committee.
What the risk team sees each morning.
The risk pages open with the key figures, then one large panel above two smaller ones; the fund decides which panel goes where. Seven of the thirty-eight are shown here, on a demonstration portfolio.
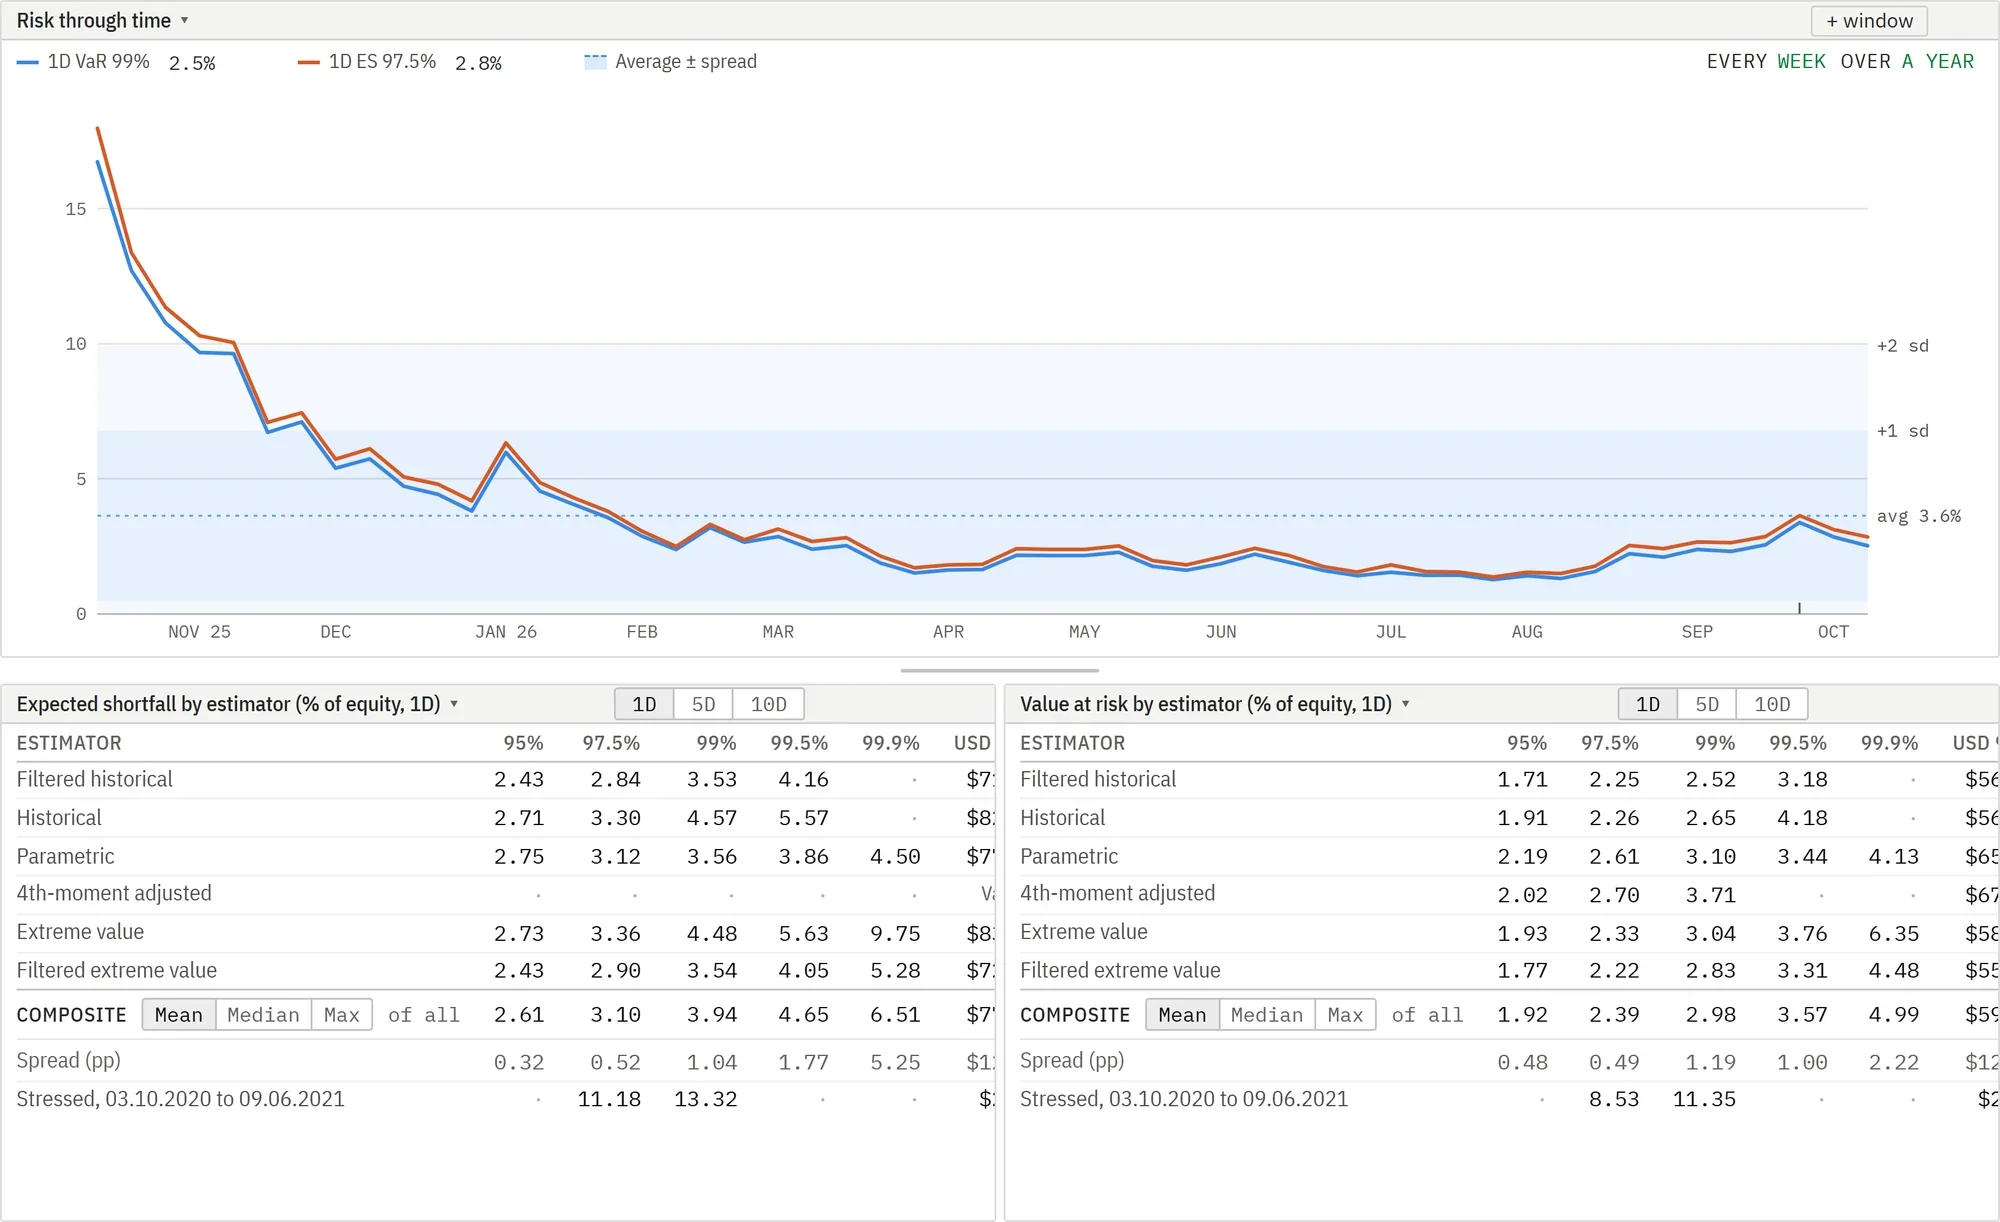
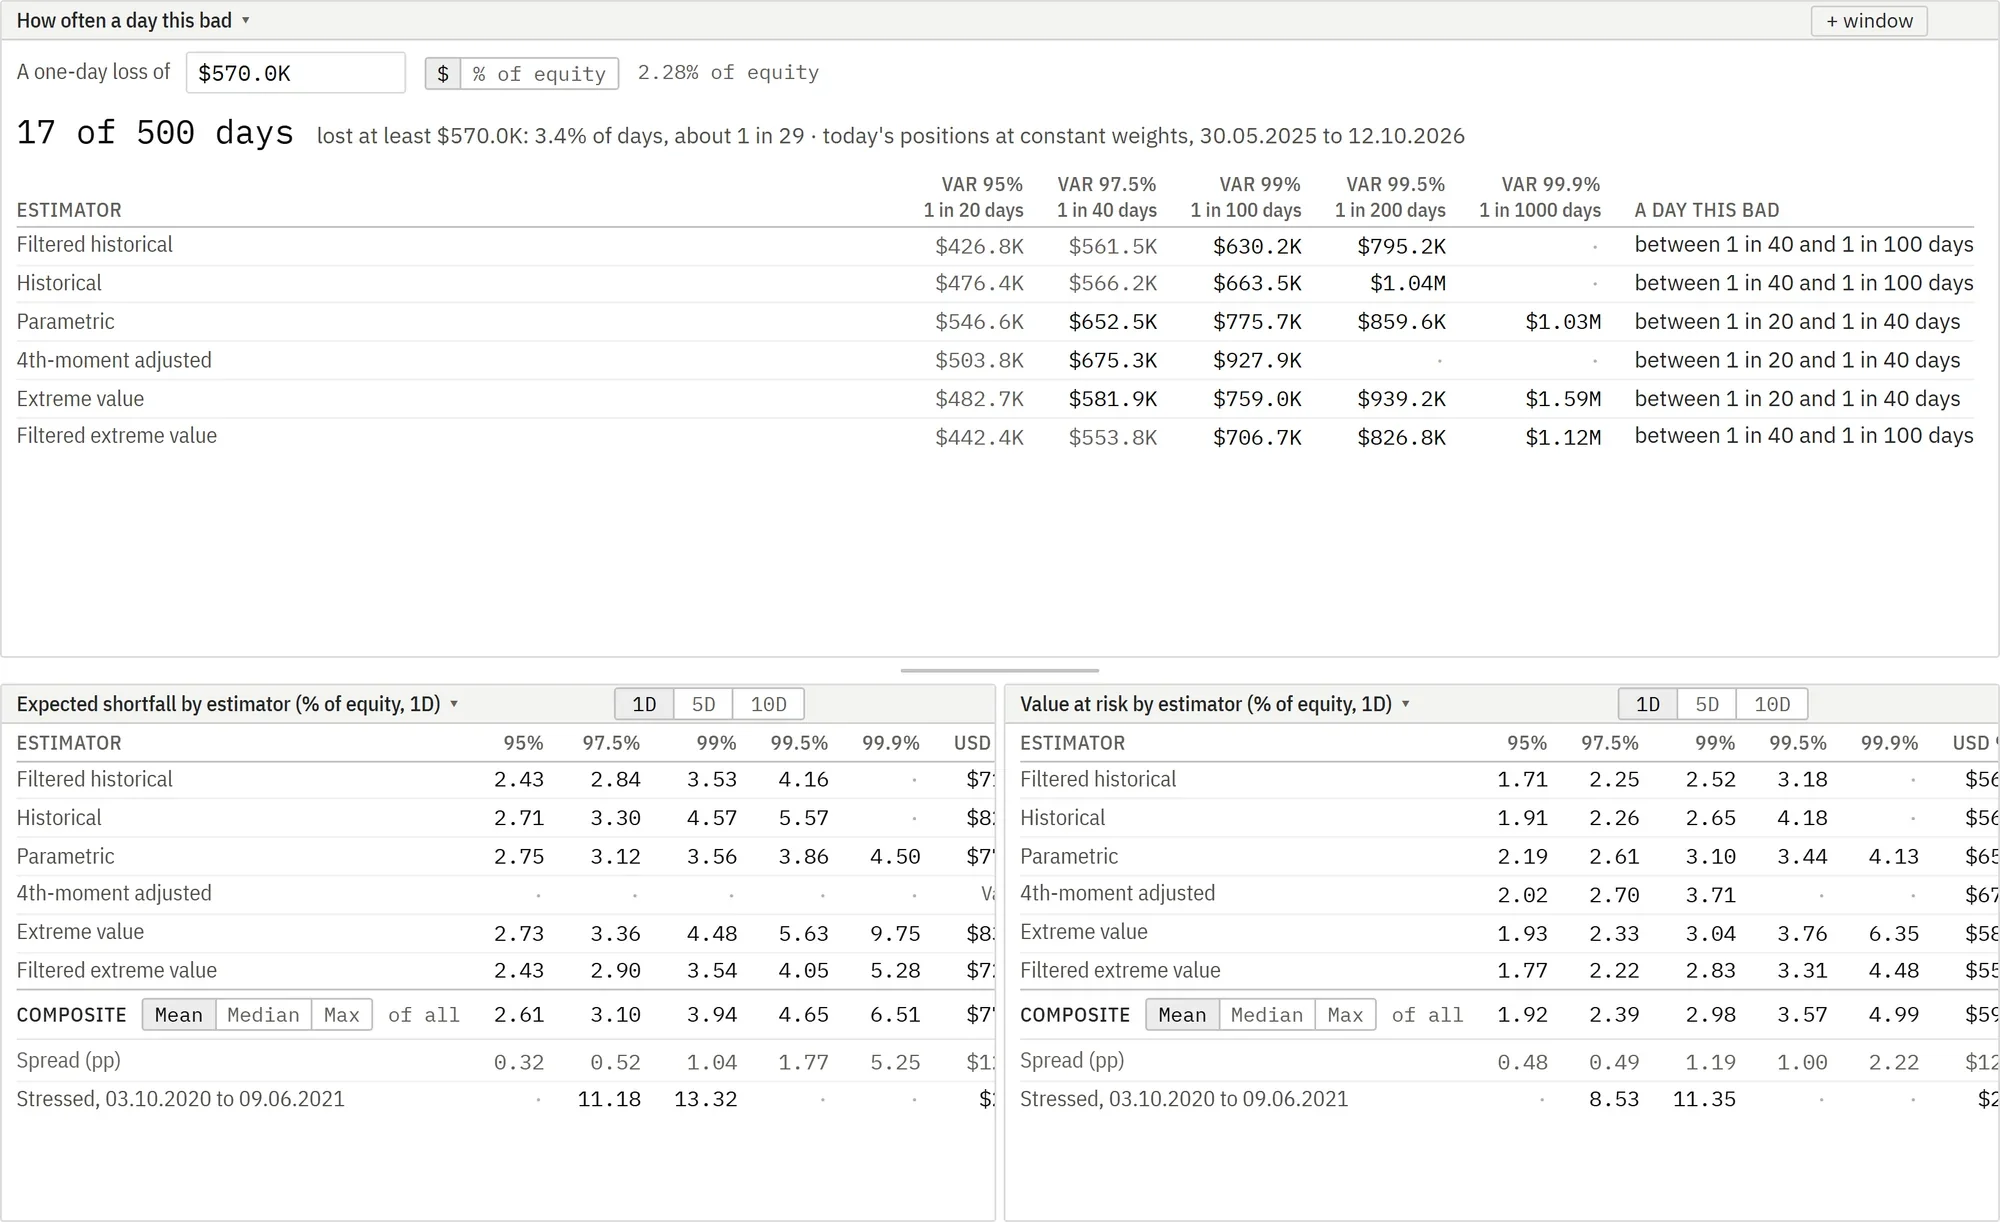
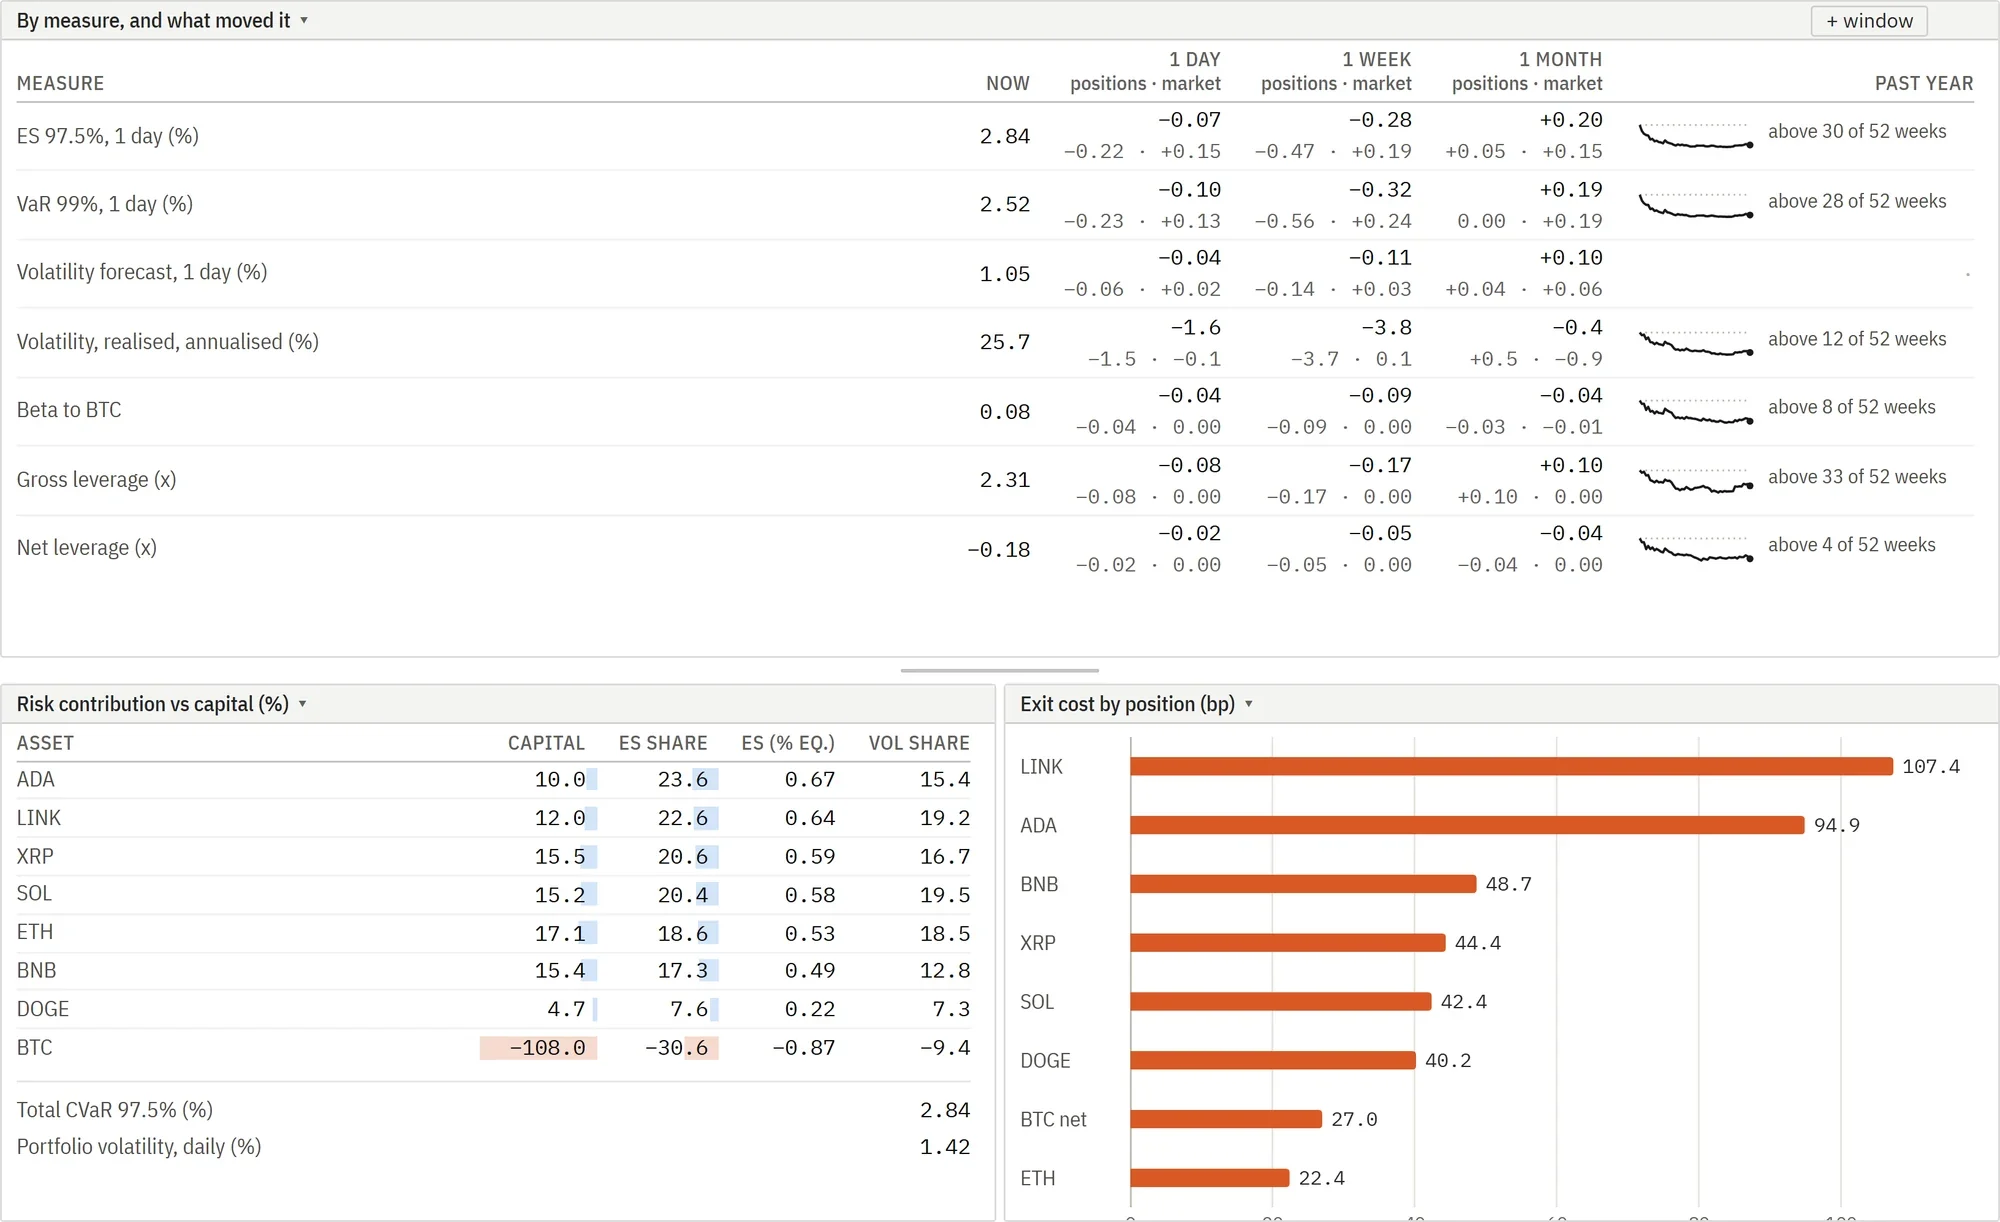
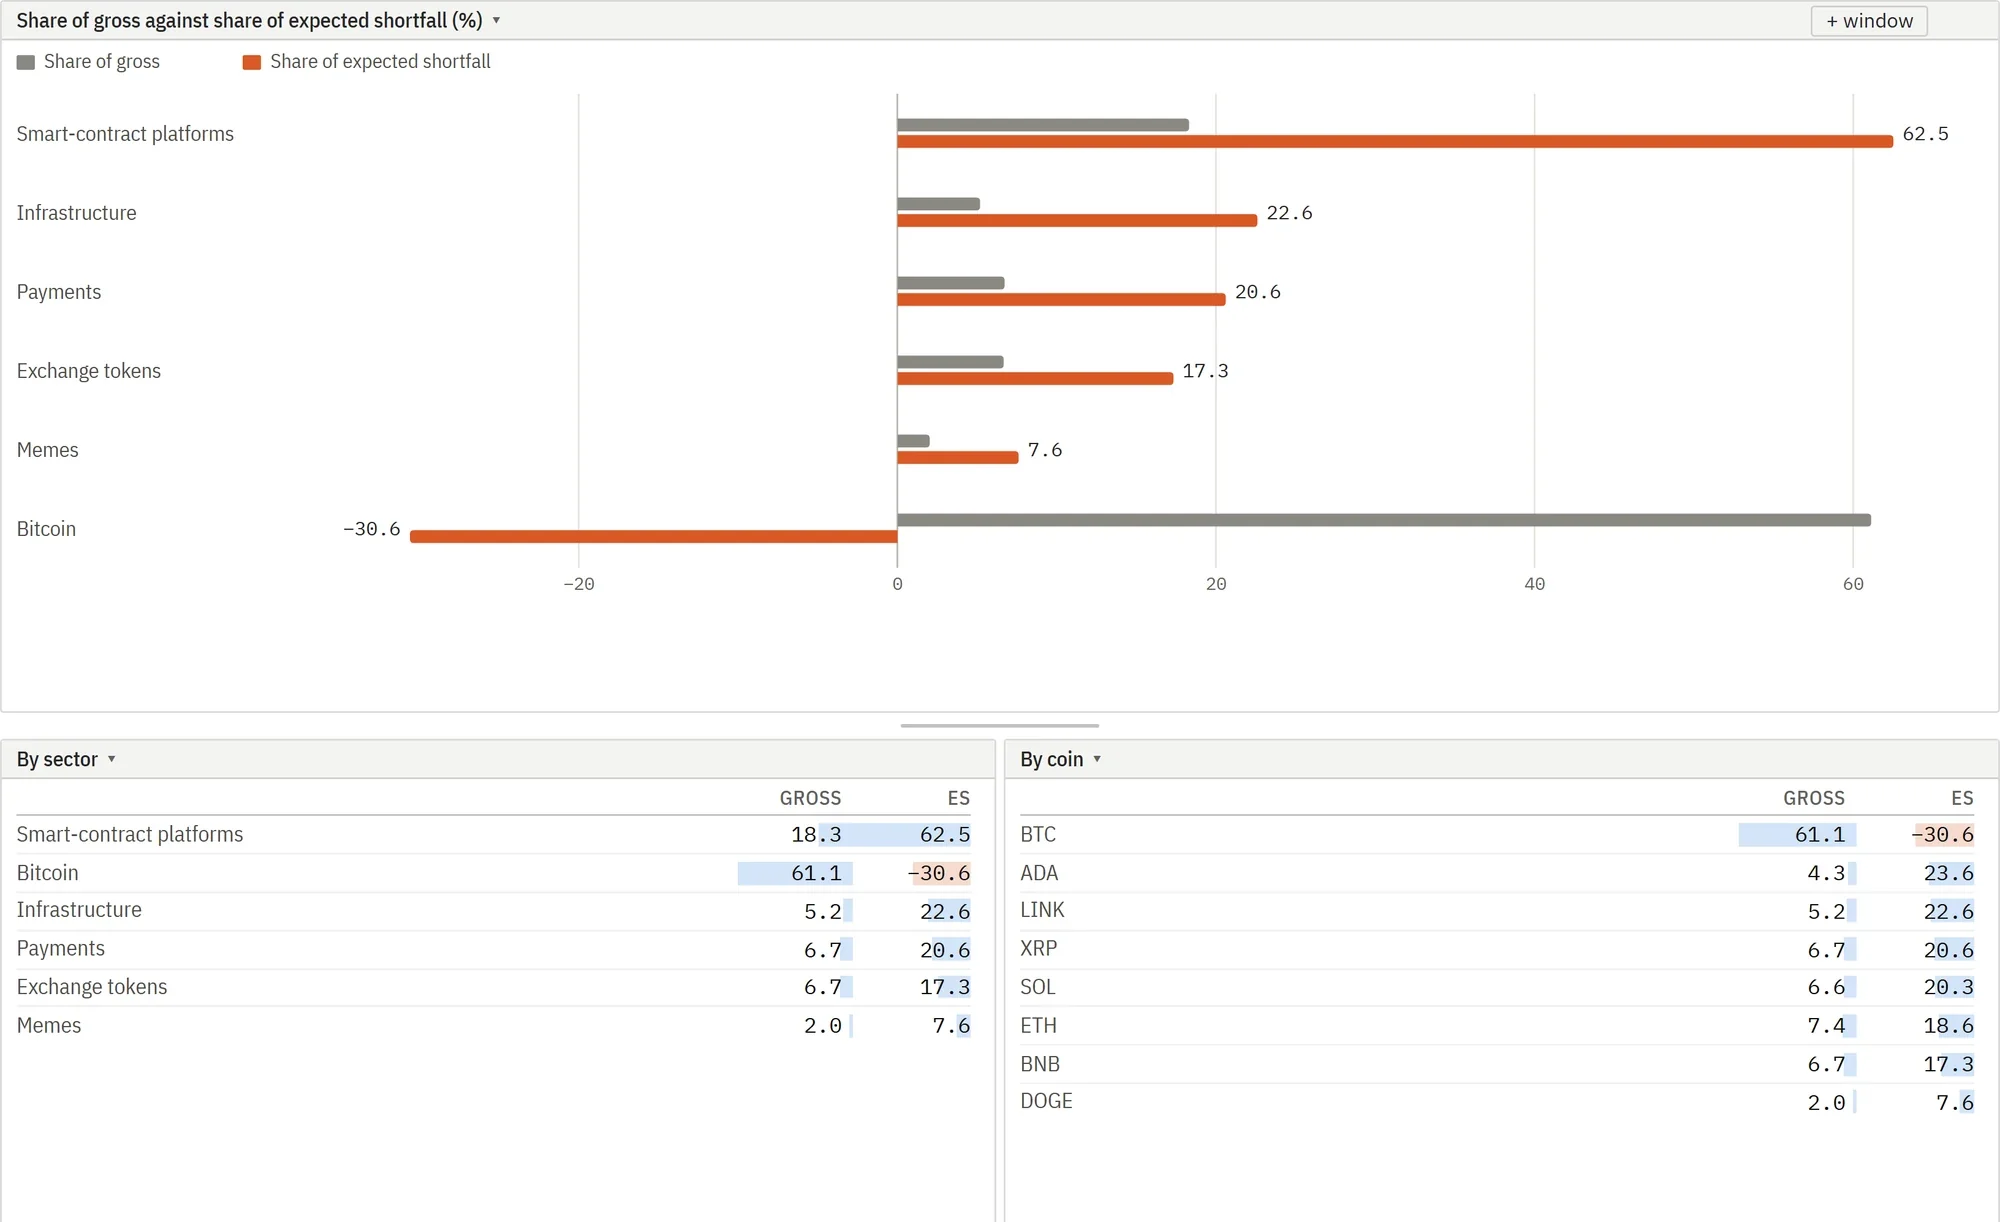
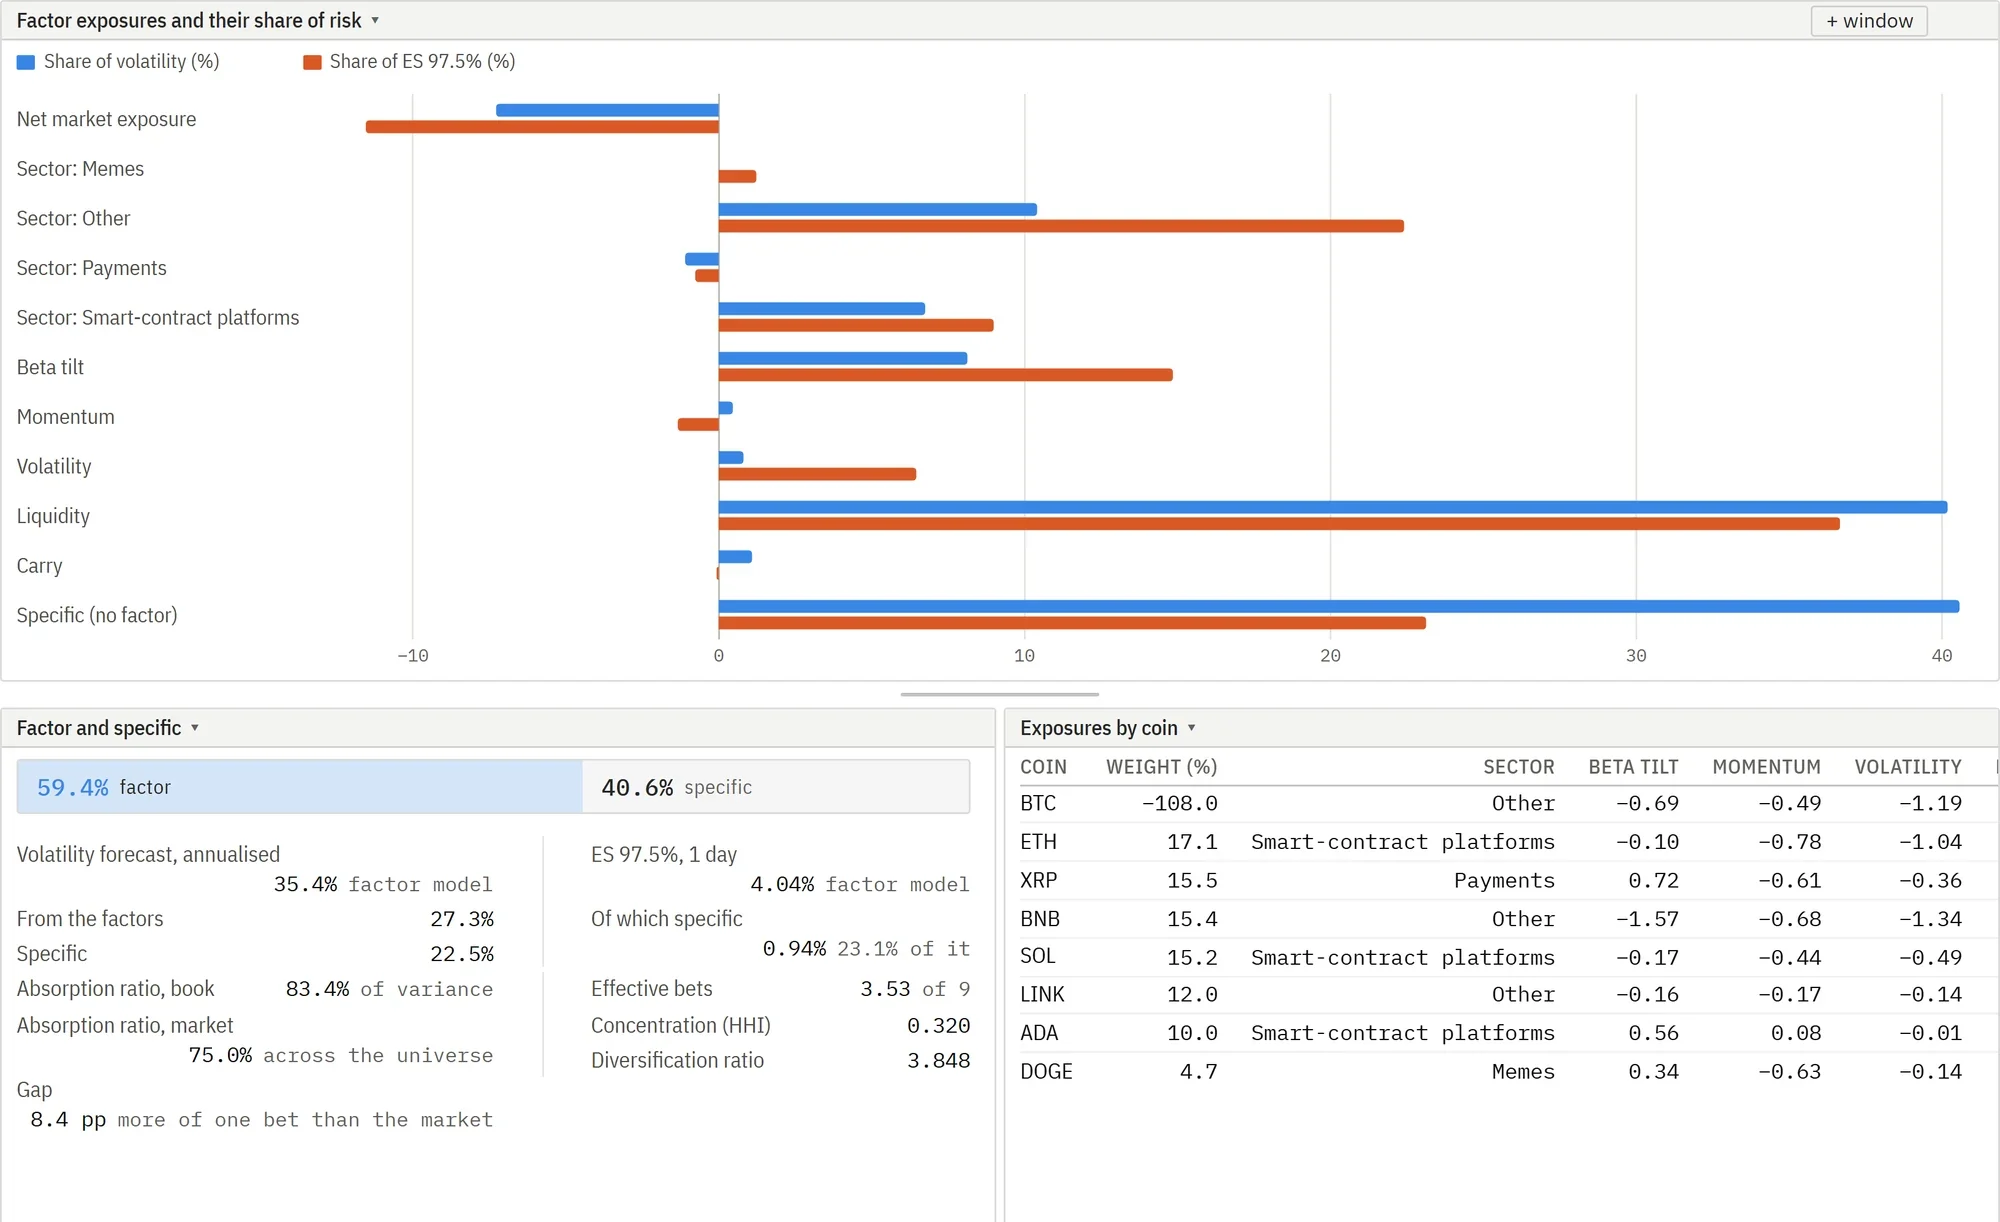
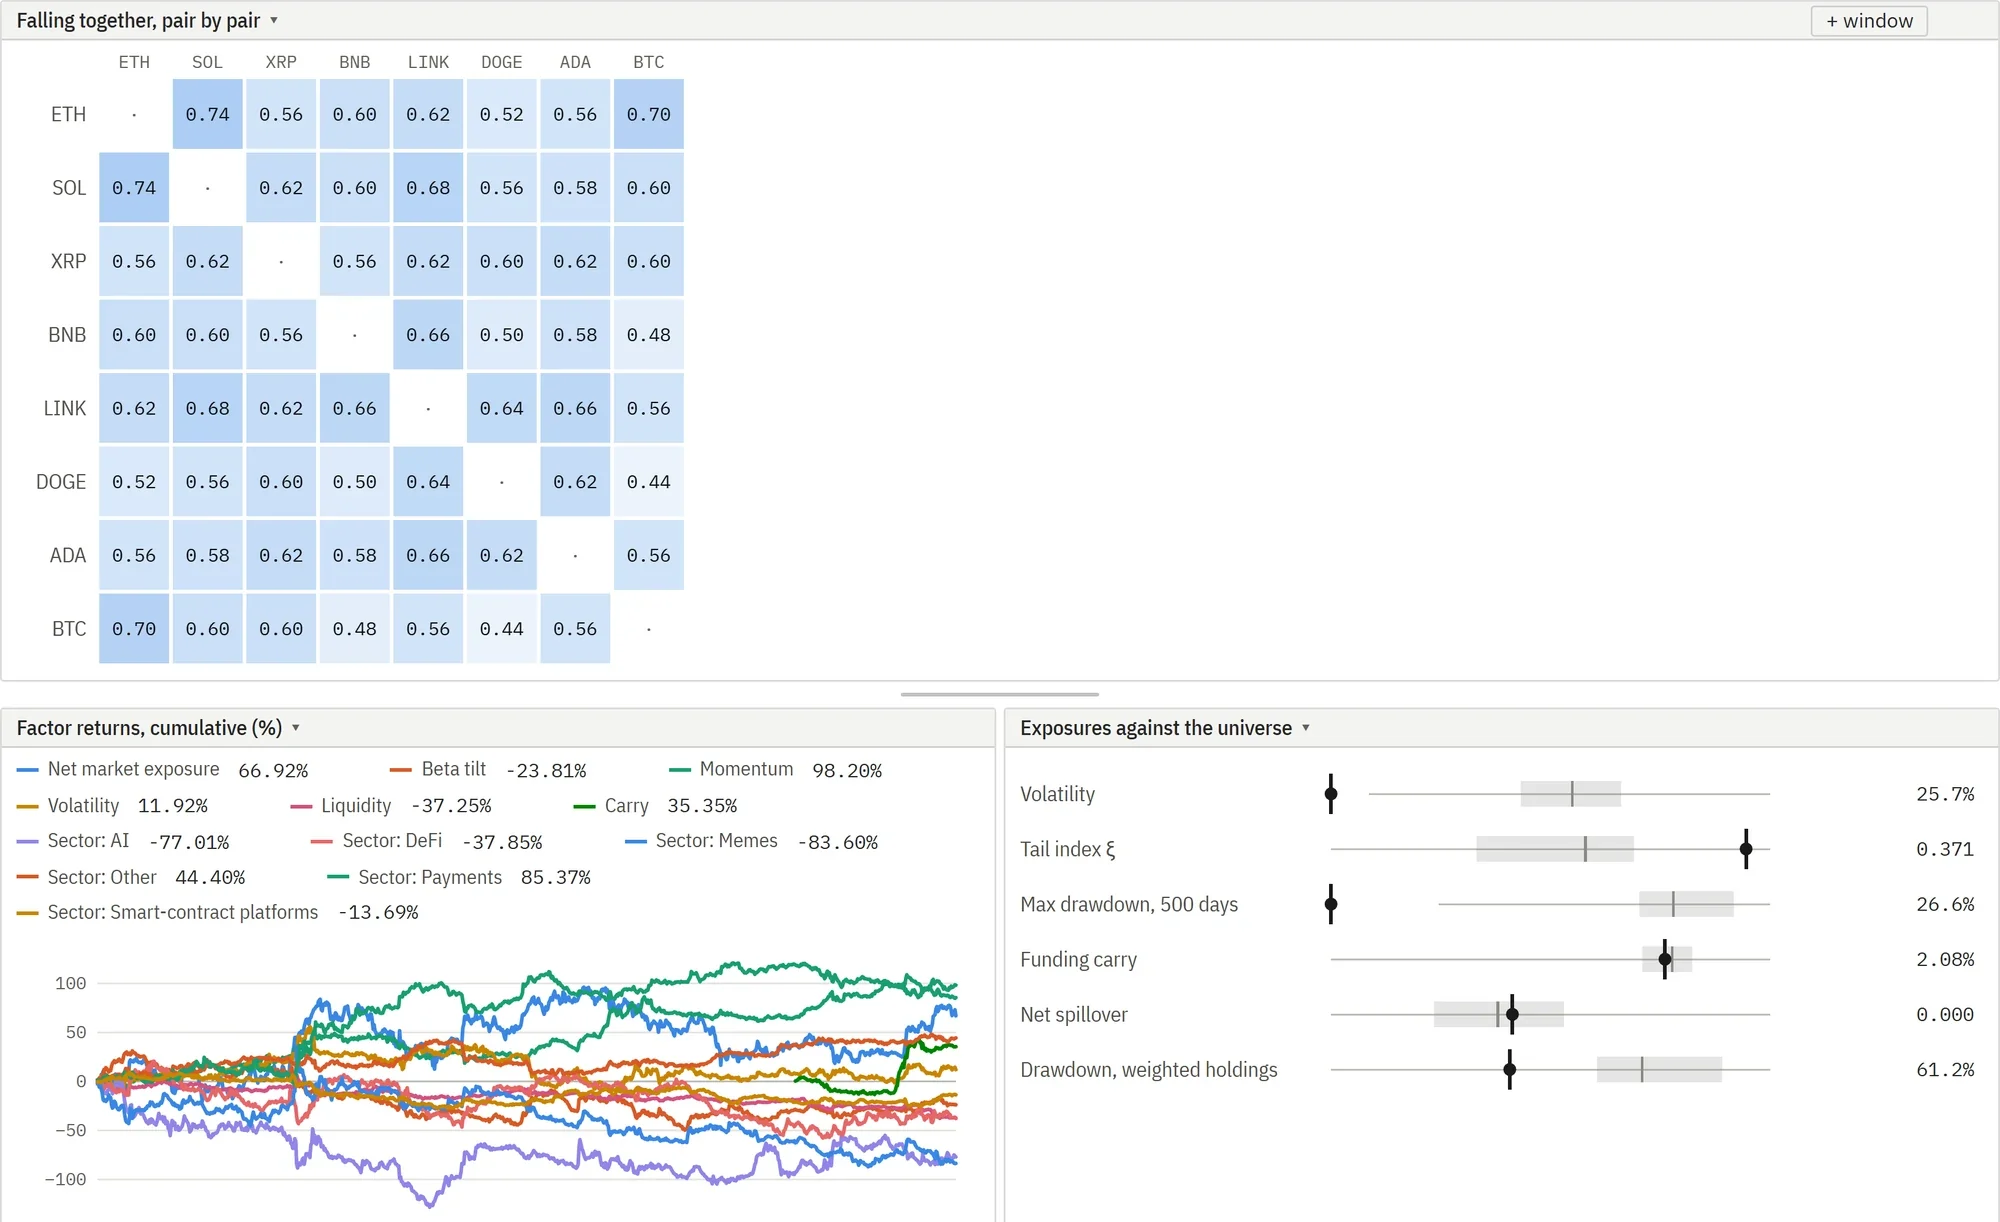
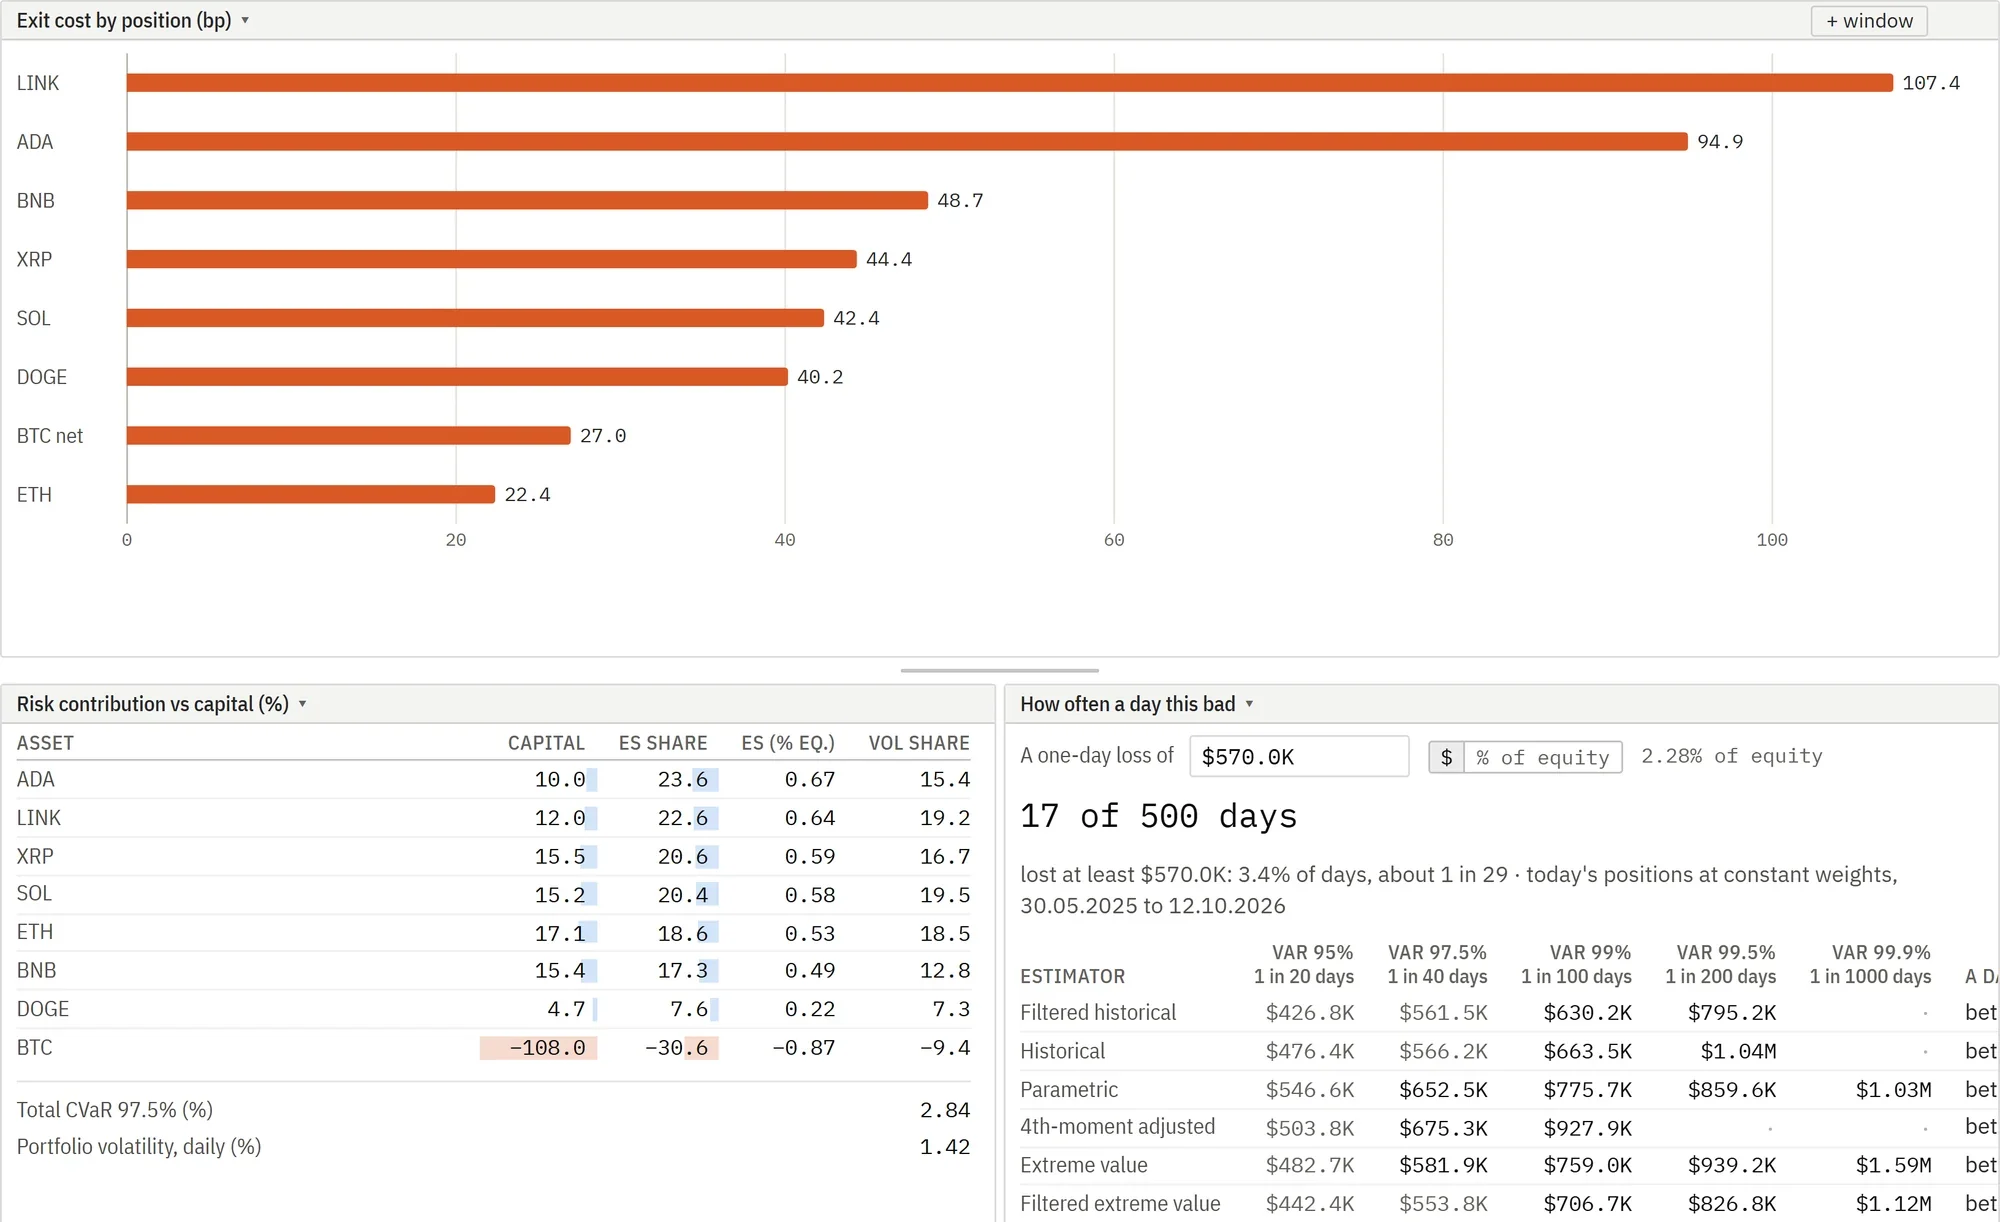
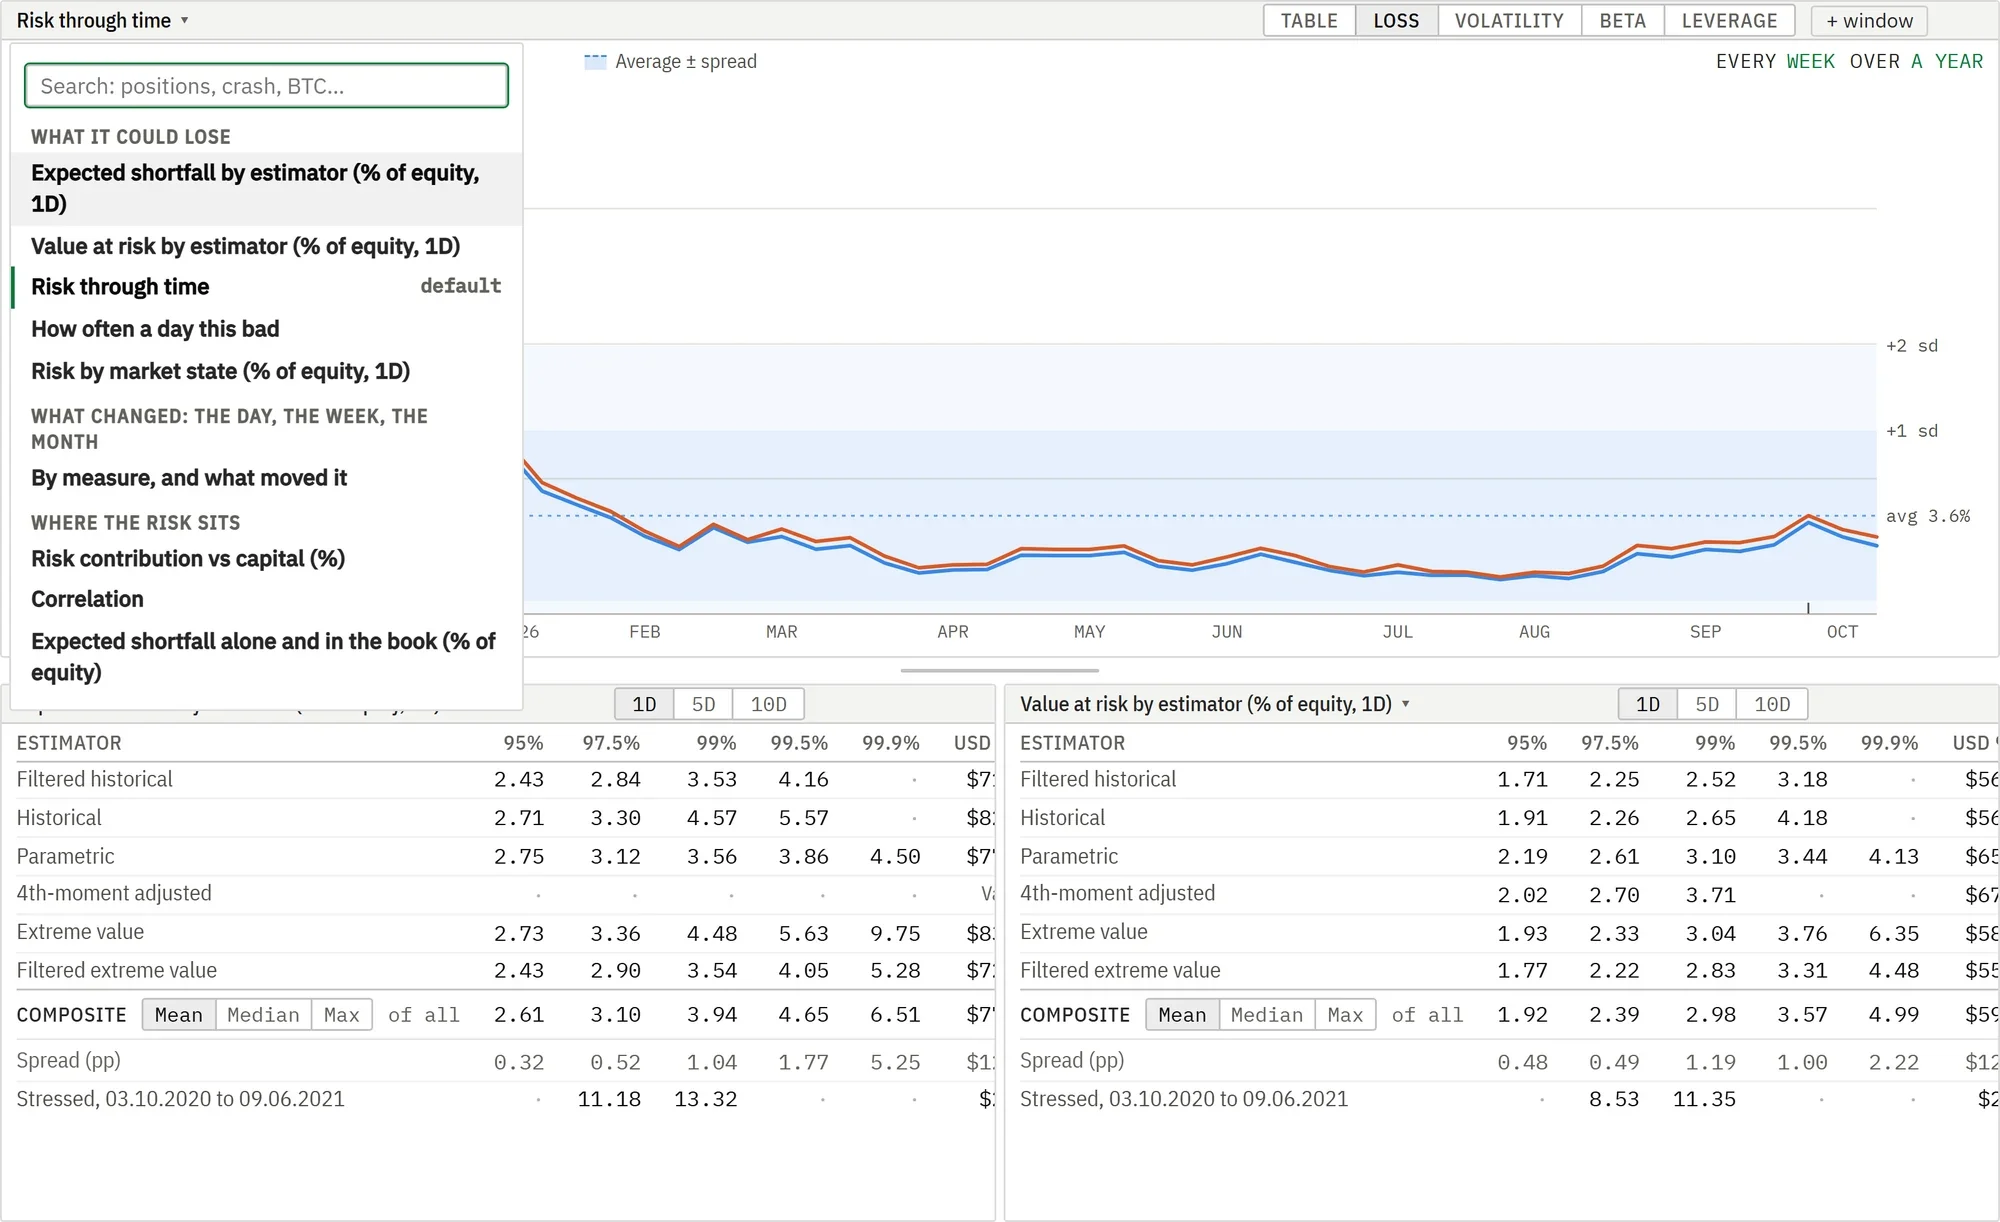
Loss by estimation method
Value at risk and expected shortfall over the past year, and the same figures under each estimation method from 95 to 99.9 percent, over one, five and ten days.
One-day expected shortfall at 97.5 percent, or $710,500. At 99 percent the methods differ by 1.04 points for expected shortfall and 1.19 for value at risk.
Everything Pearlixa Risk covers.
What the portfolio could lose
- Expected shortfall and value at risk by estimation method
- Liquidity-adjusted value at risk
- Risk through time, as held: loss, volatility, beta, leverage
- How often a day this bad occurs
Where the risk sits
- By sleeve, sector, instrument, venue, side or position
- Share of expected shortfall against share of capital, down to each position
- Differences from a chosen benchmark
- Exit cost by position, in basis points and dollars
Factors
- Market, sector and style exposures: beta to bitcoin, momentum, volatility, liquidity, carry
- Factor and specific shares of risk
- Exposures by asset and against the market
- Factor returns, and contribution by holding
What changed
- Each measure over a day, a week and a month
- Each change split into what the fund did and what the market did
When assets fall together
- Correlation over the window, today and in stress
- Tail dependence for every pair held
- The pairs most likely to fall sharply together
The reports it feeds
- Daily risk pack and morning pack
- All portfolios on one page
- Monthly risk committee pack
- Quarterly investor report
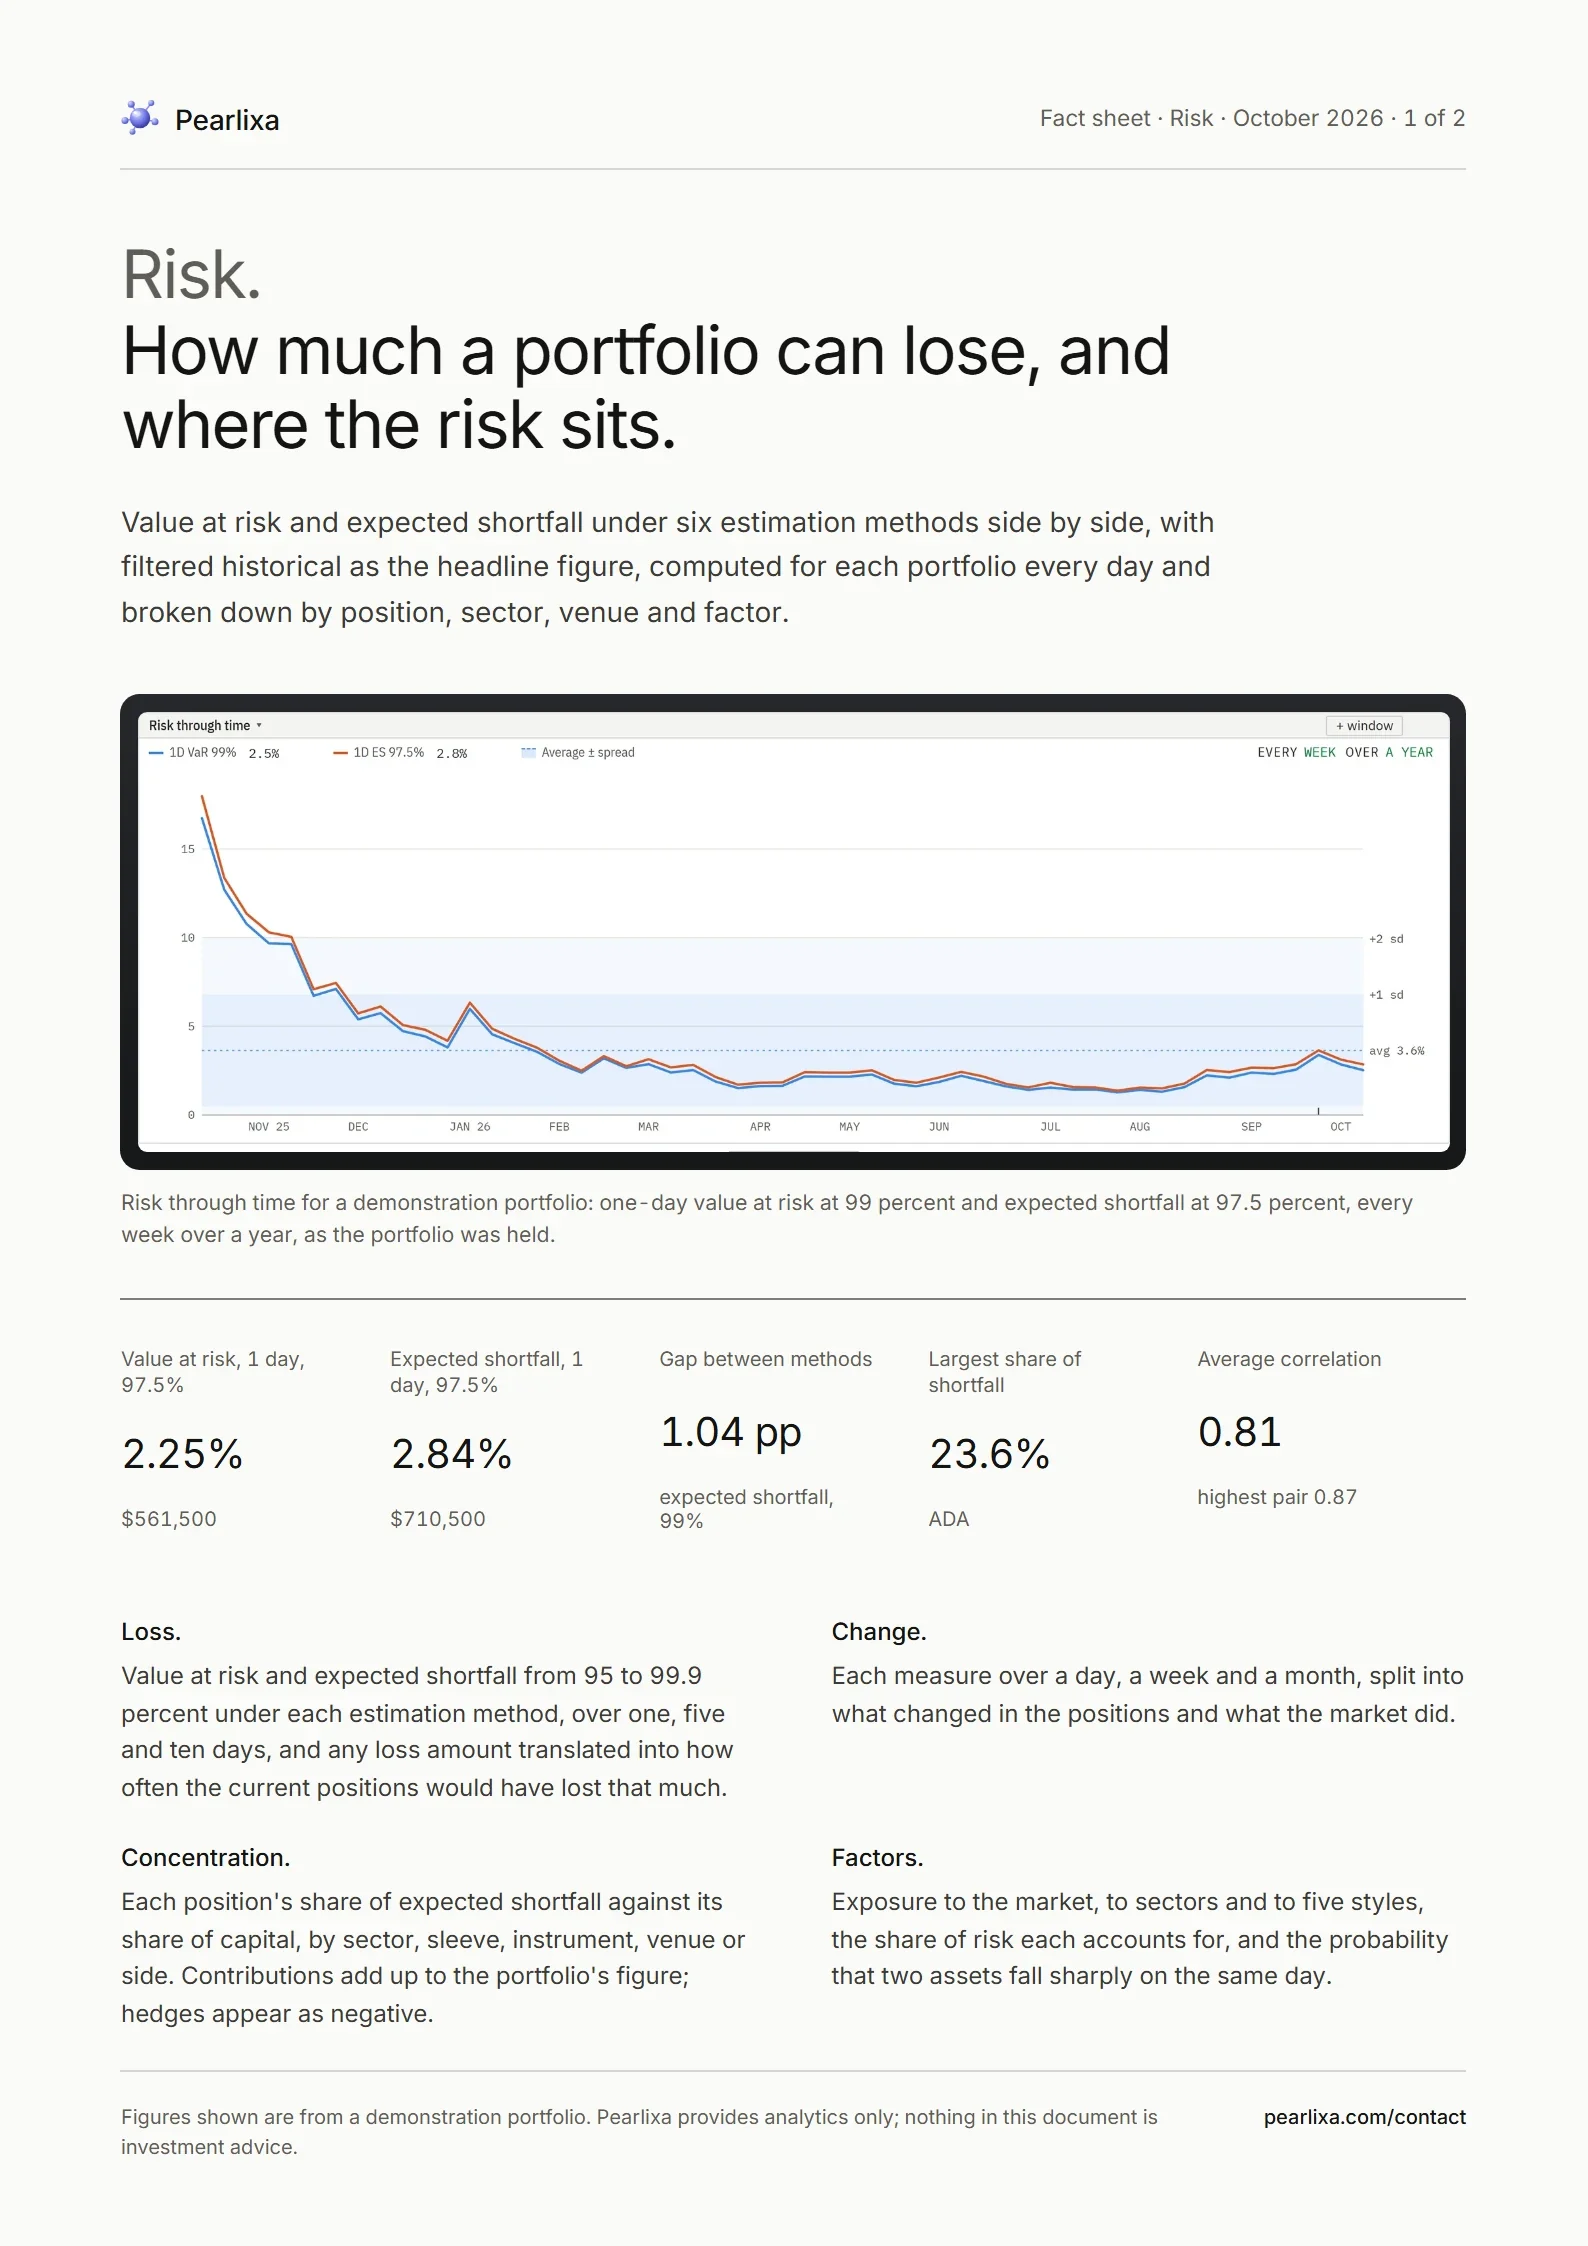
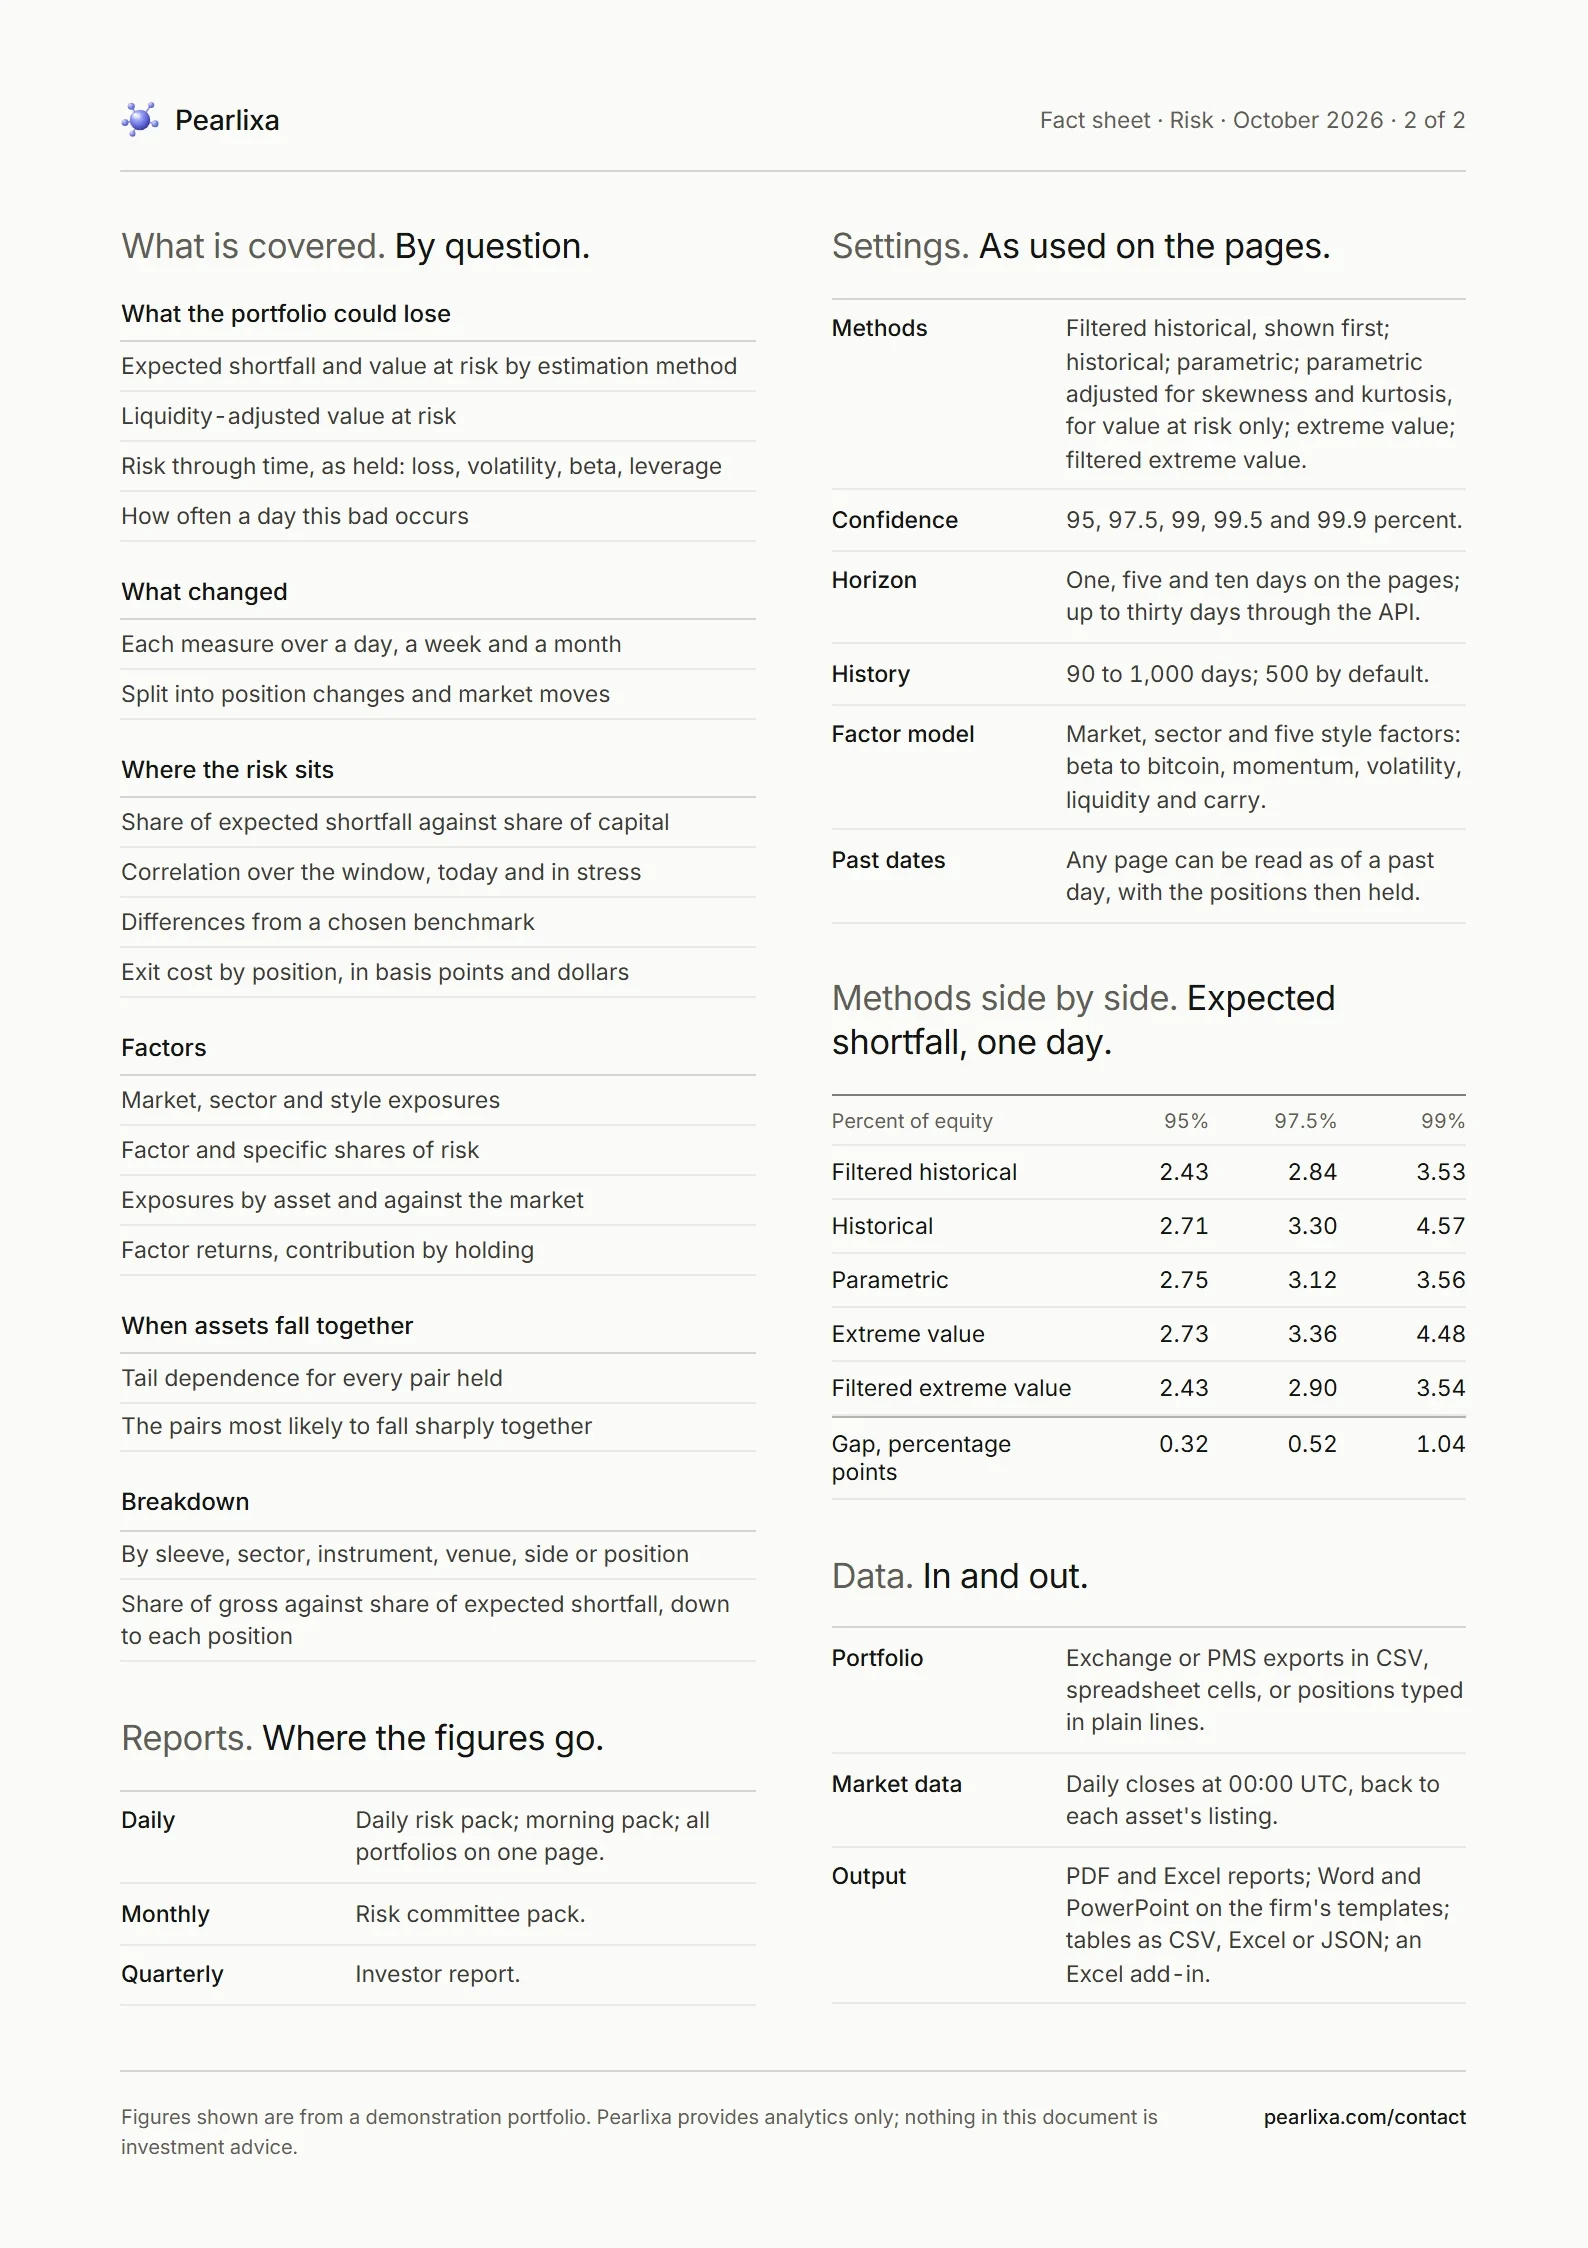
The module on two pages, to keep.
Written for the committee's file: what the module answers, every panel by question, the settings, the reports it feeds and the data that goes in and out.
Risk fact sheet ↓PDF, two pages, 750 KBEvery module reads the same portfolio.
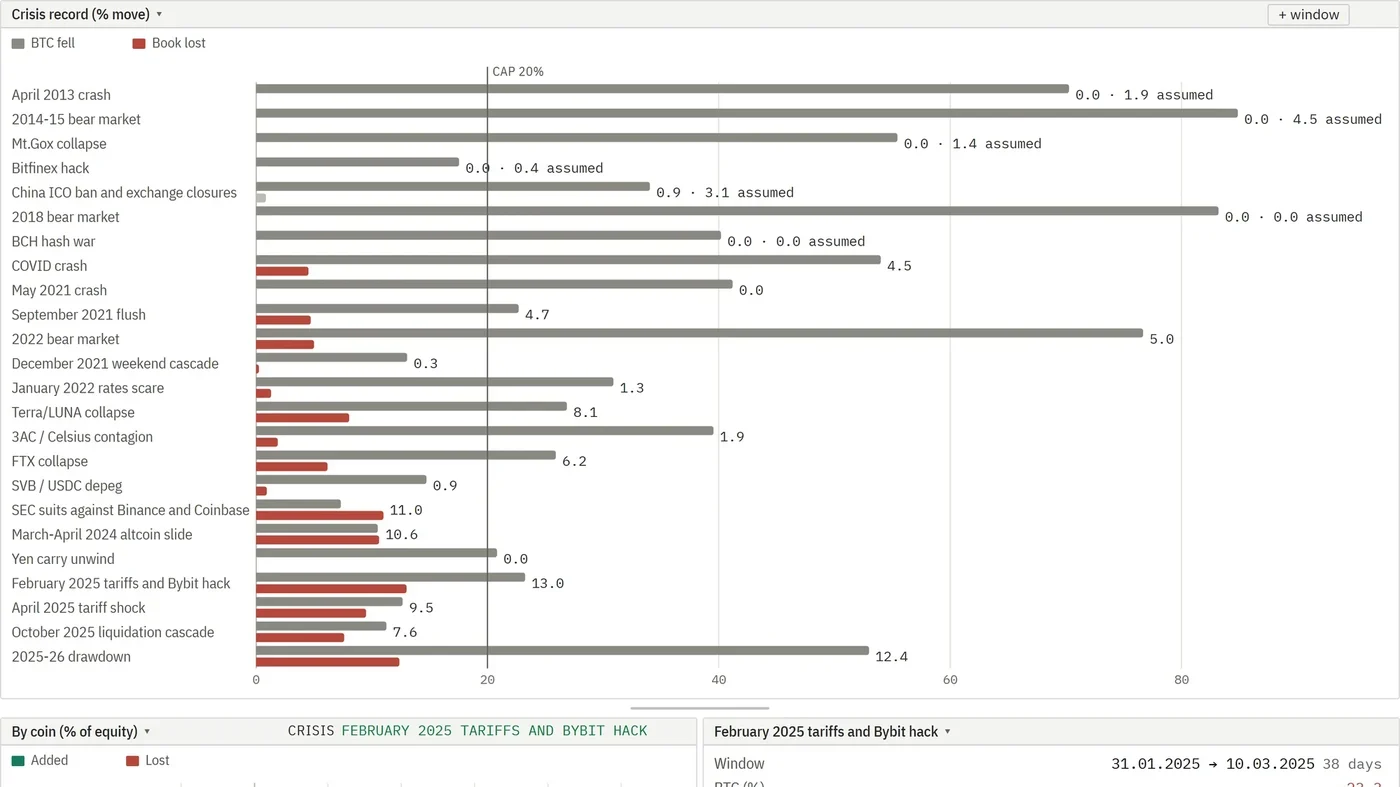 Stress testing and liquidity→Crypto crises since 2013, exit costs, redemptions
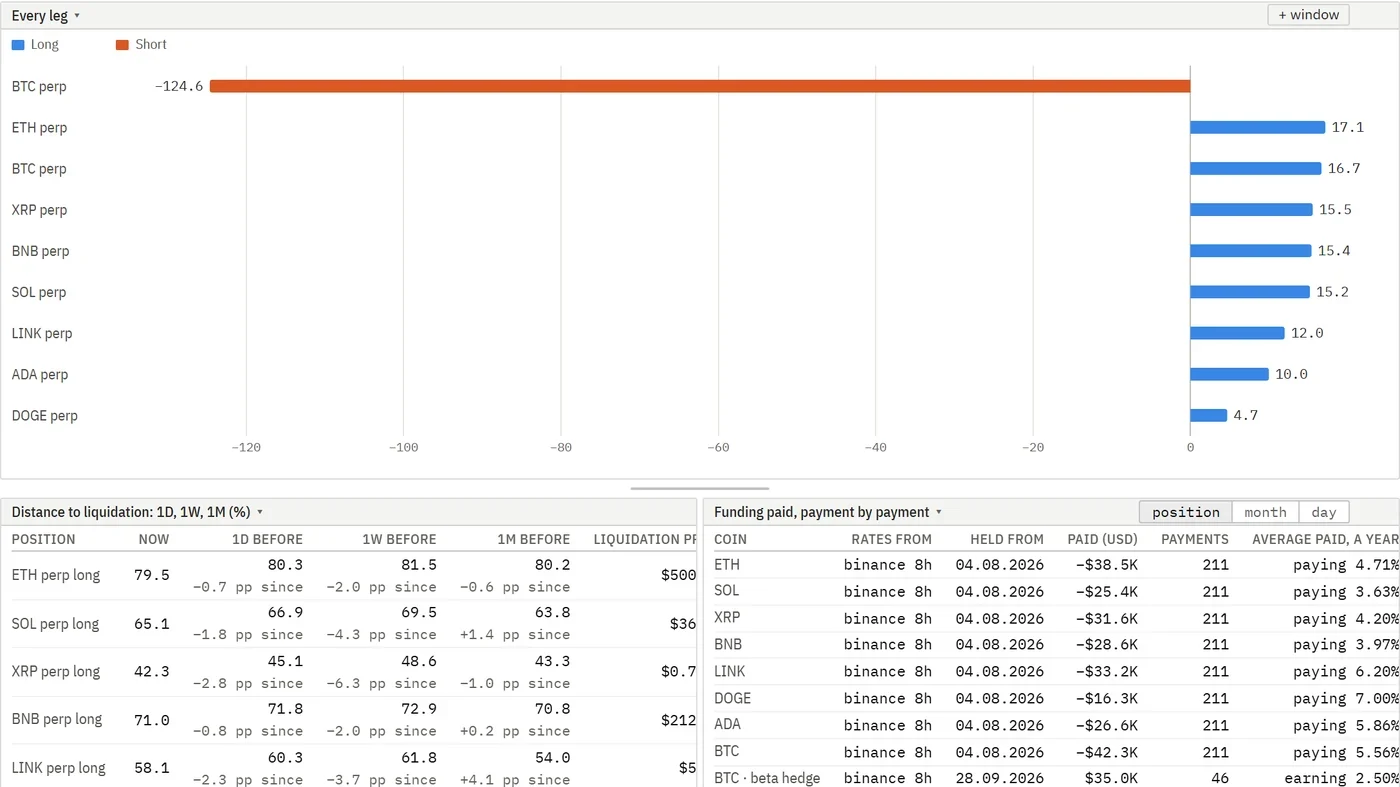 Positions and performance→Leverage, P&L, returns against benchmarks
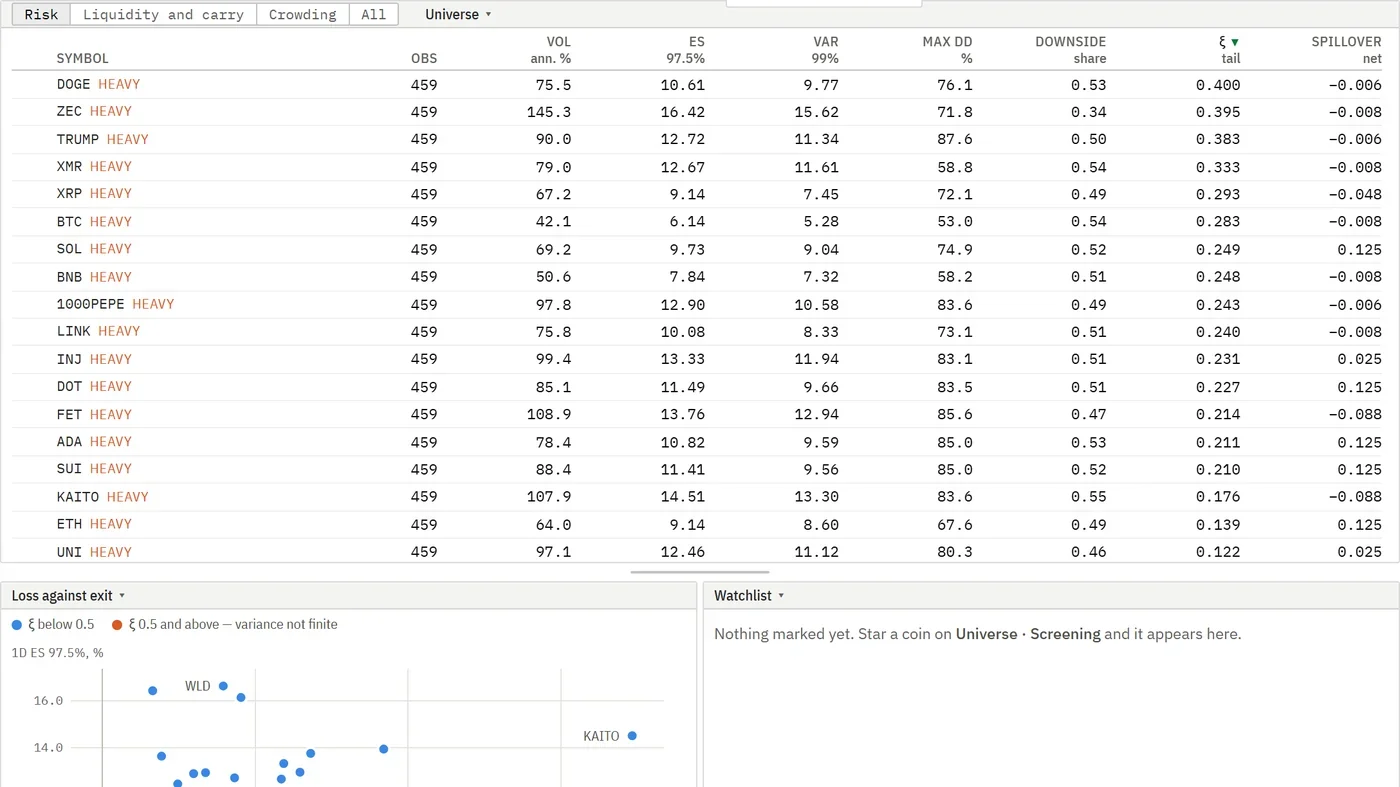 Asset analysis→Perpetual markets compared on risk, liquidity and carry
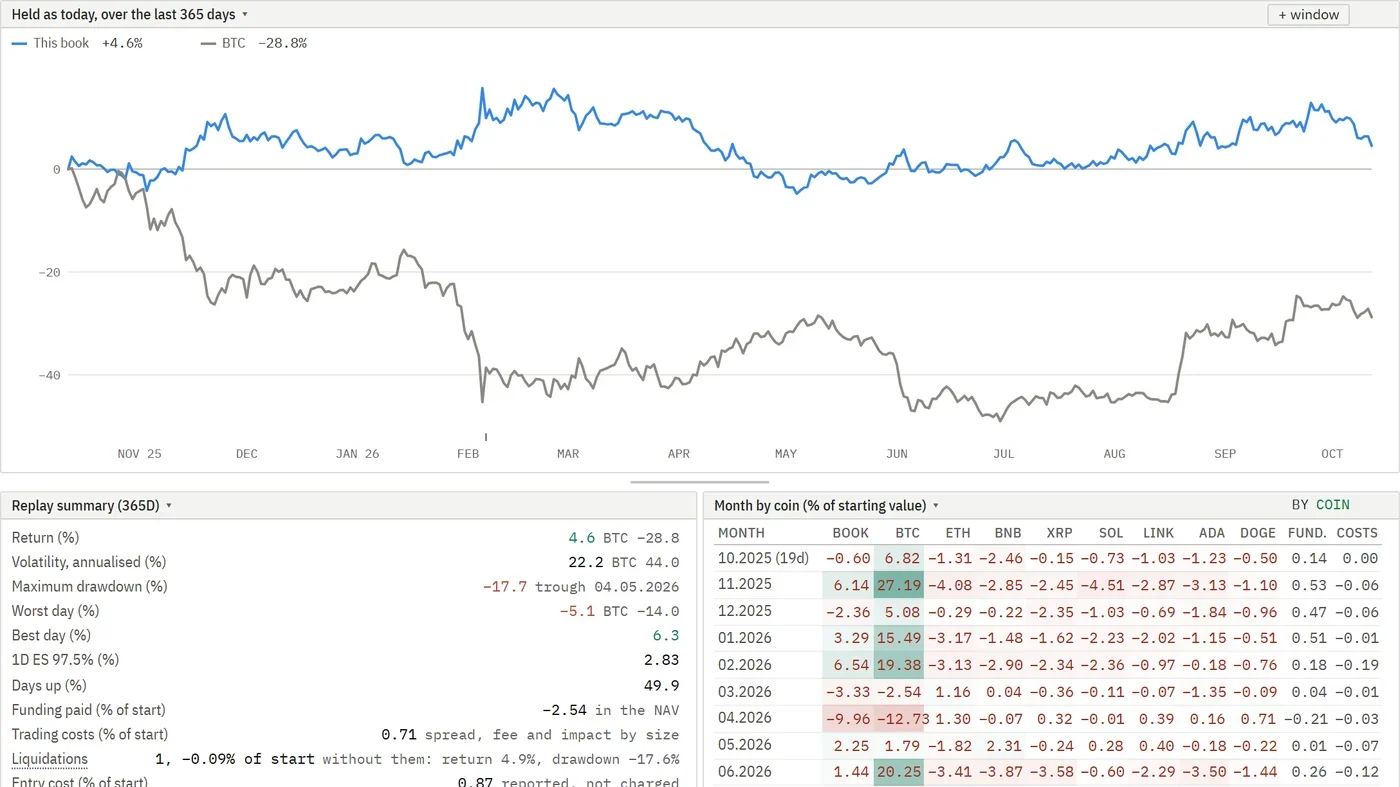 Fund-level analysis and scenarios→The whole fund, proposed changes, past periods replayed
Start with a call.
A short conversation about how your fund measures crypto risk today, followed by a live demo of Pearlixa Risk.
Book a call